At last week’s Lightfair one of the presentations was Quantifying Color Rendition: A Path Forward. The presentation was the first public look at the (not yet approved) IES Method of quantifying color rendering. What is this new (not yet approved) IES Method? Let’s start with a quick review of the current color rendering metric, Color Rendering Index (officially CIE 013.3-1995 Method of Measuring and Specifying Color Rendering Properties of Light Source) or CRI.
CRI is a fidelity metric. It compares the color rendering properties of a light source to the properties of a light source of the same color temperature, either a black body radiator for color temperatures below 5000 K, or a model of daylight for color temperatures of 5000 K and above. First issued in 1965 and last updated in 1995, CRI has several known defects. It is based on outdated color science, there are too few color samples (only eight for the general color rendering index, or Ra), and the color samples are Munsell colors, not those of real world objects.

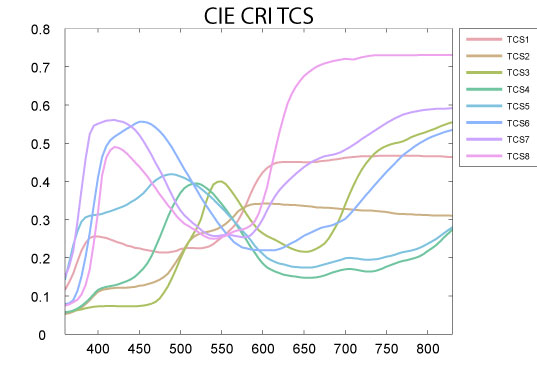
Finally, since the colors used don’t give equal weight to all wavelengths of visible light, as shown below, lamp manufacturers can optimize their lamps spectral power distribution (SPD) to achieve higher scores.
The new calculation procedure is called TM-30 IES Method for Evaluating Light Source Color Rendition. It is, in my opinion, substantially better than CRI for several reasons. A disclosure – the Color Metrics Task Group that developed TM-30 is an offshoot of the IES Color Committee, of which I am the vice-chair.
TM-30 is a dual metric system. It provides us with a measurement of fidelity (Rf), although using a completely different method than CRI. It also provides us with a measurement of gamut (Rg). In this case, gamut means that it gives us a number that tells us if a light source that scores lower than 100 on the fidelity metric (and is therefore not a match to the reference light source) increases saturation of colors making them more vibrant, or desaturates colors making them grey or dull. This gives us a much better understanding of the color rendering performance of the light source in question. These two numbers are supplemented with a variety of graphics. These include a graphic showing the color distortion produced by the lamp, a graphic showing the change in gamut, and a graph of the Rf and Rg indexes.
It’s the color samples and calculation procedure, however, that drive this new method. Among the improvements are:
- The use of 99 color samples drawn from real world objects
- Color samples that are evenly distributed throughout the most accurate color space and throughout the wavelengths of visible light
- It draws from a wide range of color perception research
- It is based on an objective and mathematical approach
TM-30 is in the final stages of balloting. I believe that it will be approved by the end of the summer. Once it is, I’ll have more to say and graphics to explain it better. Stay tuned.