In addition to an index that measures the fidelity of a light source to its reference source (Rf) IES TM-30 includes an index that indicates the change in saturation of colors called the Gamut Index and abbreviated Rg. Rg is calculated using the same Color Evaluation Samples (CES) and underlying calculation engine as Rf, which makes TM-30 a cohesive system.
Here’s how Rg works. An Rg value of 100 indicates that, on average, the light source in question does not change the chroma, or saturation, of the 99 CES when compared to the reference light source. An Rg value below 100 indicates that, on average, the light source renders colors as less saturated than the reference source, and an Rg value above 100 indicates that, on average, the light source renders colors as more saturated than the reference source.
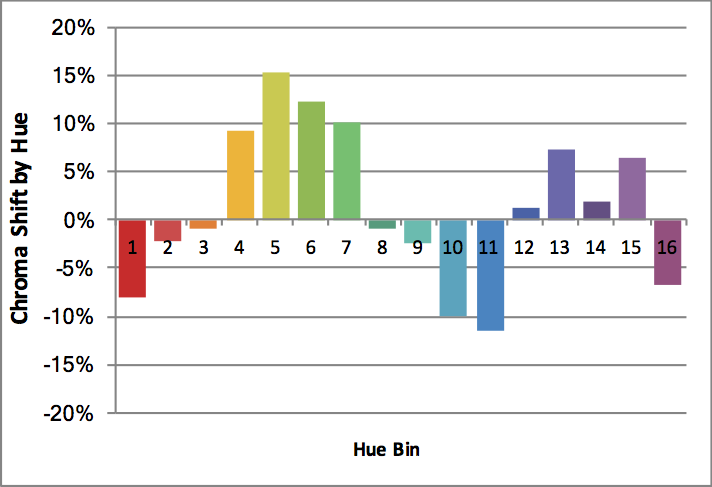
Since Rg is an average it says nothing about the possible change in chroma for any individual hue angle bin or for any individual color evaluation sample. That’s ok, thought, because TM-30 also tells us the Rg values for each hue angle bin, and for each CES.
Here’s an example of the graphic for the hue angle bins using the same light source as the previous post on Rf.
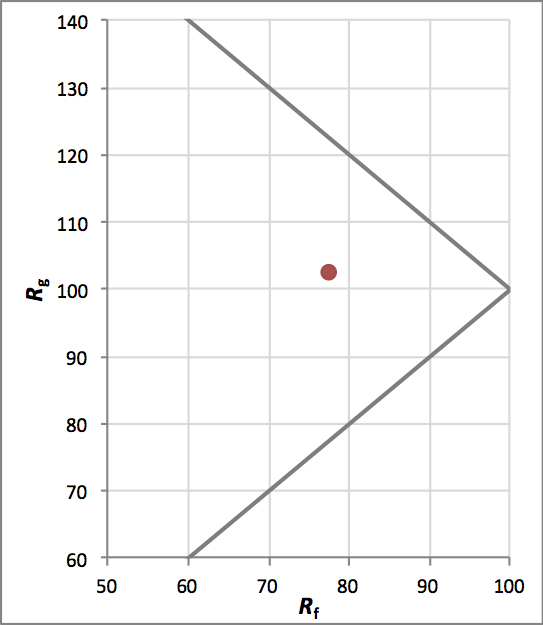
TM-30 doesn’t recommend any particular Rg or set of Rg values. As with Rf, the interpretation of the information is left to the specifier. Acceptable or desirable values will vary by application. Rg doesn’t have a maximum or minimum value, but the possible range increases as Rf decreases, as shown below. The wedge to the left of the gray lines shows the range of possible Rg values, while the red dot represents the lamp we’ve been discussing.
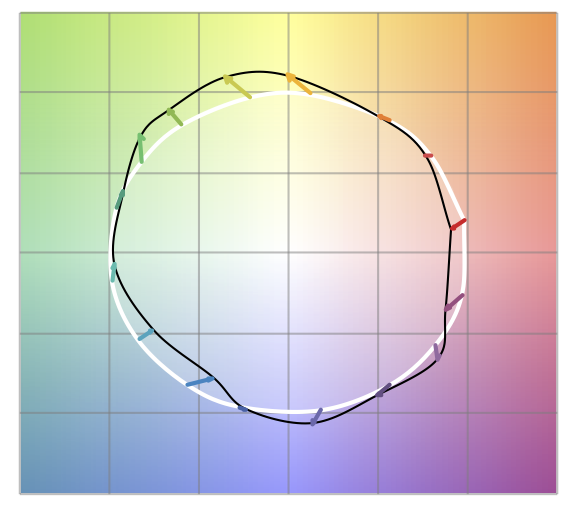
The Rg values are also presented in a Color Vector Graphic (CVG), as shown below. The white circle is the normalized reference source. The black circle is the lamp in question. Where the black circle is inside the white, colors are desaturated. Where the black circle is outside of the white, colors have increased saturation. The colored arrows indicate the direction of saturation shift, and the direction of hue shift. Arrows that point straight in or out show only saturation shift. Arrows that show rotation left or right also indicate hue shift. I know! And, the next version of TM-30 will present a graph showing the hue shift!
Research is revealing that we shouldn’t treat all hue angle bins the same. Bins 1 and 16, which include the most red, are indicative of preference and it seems likely that they will take on increasing importance in that role. Some specifications are already acknowledging this. For example, the Department of Defense recently re-issued the Unified Facilities Criteria for Military Medical Facilities that establishes the following requirements for light sources:
Fidelity Index: Rf ≥ 80,
Relative Gamut Index: 97 to 110,
Fidelity Index, Hue-Bin 1: ≥ 78,
Chroma Shift, Hue-Bin 1: -9% to +9%.
Clearly, TM-30 permits us to be much more specific about the color rendering that is acceptable or desirable for a project. Why bother with CRI anymore?