Focal Point Introduces TM-30 Based “Preferred Light”

Today Focal Point Lights of Chicago, IL introduced a series of fixtures that feature what they call Preferred Light.  Preferred Light is based on recent studies at PNNL and Penn State, plus their own study, and uses TM-30’s Rf, Rg, and Hue Bin 16 values to establish a balance of fidelity, saturation, and red rendering that is “visually appealing to humans.”

The overall idea is that people seem to prefer a light source that slightly over saturated most colors, especially red.  “Using a custom LED mix, Focal Point defines Preferred Light using TM-30-15 metrics as having a fidelity (Rf) of 89, a gamut (Rg) of 107, and over-saturating Hue Bin 16, deep red content, by 9% at a [Correlated] Color Temperature of 3500K.”  So, by using the statistical measures of TM-30 and applying them to the related topic of color preference Focal Point has identified an optimized set of LED products to meet their customers’ needs.

I’ll be the first to admit that it may be risky to base all of this on only three studies, but other studies have shown that the TM-30 results can be applied in this way, and are also showing us the relative importance of the various calculated values.  I’m excited to see the industry using the tools, and am looking forward to seeing the Preferred Light for myself.

TM-30 Rf: So Big, So Strong, So Smart!

As we know, CRI Ra and TM-30 Rf are both measurements of color fidelity.  That is, they compare a test light source to a known reference light source and measure how well the test source matches the reference source.  One of the many shortcomings of CRI Ra is that it provides us with a single value.  That single value is easy to use, but doesn’t tell us anything about what colors will have increased saturation, decreased saturation, hue change, or will be unaffected.

TM-30 is a tougher test than CRI, so how do Rf and Ra values relate?  Lamps with Ra values below about 70 tend to have higher Rf values, while lamps with higher Ra values tend to have reduced Rf values.  Of course, this doesn’t mean that the lamps we think of as better have suddenly become worse, it’s just that we’re scoring on a different scale.  This means that we can’t draw direct comparisons.  For example, Energy Star requires that lamps have a minimum CRI Ra of 80, but that doesn’t mean that they should also have a minimum Rf of 80.  Different tests give different results and we have to be careful not to apply the meaning of one to the scores of the other.

IES TM-30’s Rf mathematically compares the appearance, under a test light source, of 99 color evaluation samples (CES) that are derived from real world objects, to the CES appearance under a reference light source of the same CCT.  The distance of the color shift for each CES is measured in the CAM02-UCS color space and averaged.  Throw in a lot of calculus (which we don’t need to get into) and voila, the Rf value.  It’s important to remember that what we get is just a number.  TM-30 doesn’t qualify any of the results as good or bad, desirable or undesirable.  It presents information to the lighting specifier and allows the specifier to apply education, professional experience, and knowledge about the project to determine whether or not a given light source is appropriate.

As with Ra, the single value of Rf conveys limited information.  It is more accurate, but still only tells us the average match or mismatch between the two light sources.  What makes TM-30 so powerful and useful is that it tells us much more if we want to know.  For example, using the Calculation Tool that can be downloaded with the purchase of TM-30 (which I wish the IES would make freely available), we can see that one common F32T8/830 has the following characteristics:

Rf   78
Rg   102
CCT   2943
Duv   0.0014
Ra   85

This lamp has moderately good fidelity (Rf), a slight increase in saturation (Rg), has a CCT of just under 3000K, and is slightly above the black body locus and therefore is slightly green (Duv).  The Advanced Calculation Tool tells us that the R9 value is 2 and that the Rf for skin is 85.  It also tells us the (x, y), (u, v), and (u’, v’) chromaticity coordinates (which, frankly don’t mean anything to me, but the information is there).  This information is immediately useful and isn’t provided as part of the CRI calculation.  In addition, most light source manufacturers don’t tell us the Duv, although understanding it is becoming increasingly important, especially now that NEMA has extended the chromaticity bins for LEDs in ANSI/NEMA C78.377 American National Standard for Electric Lamps – Specifications for the Chromaticity of Solid-State Lighting Products.  That’s a post for another time.

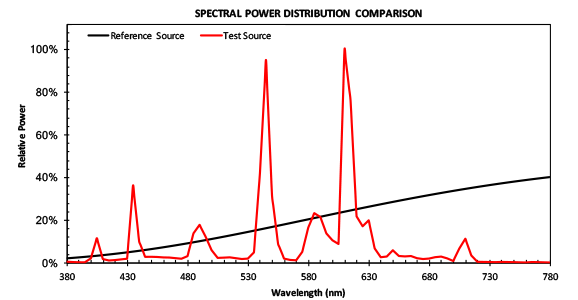
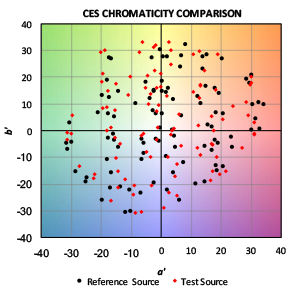
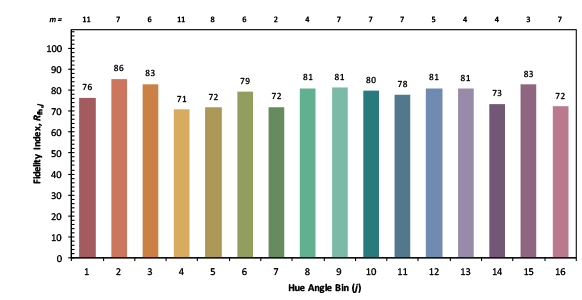
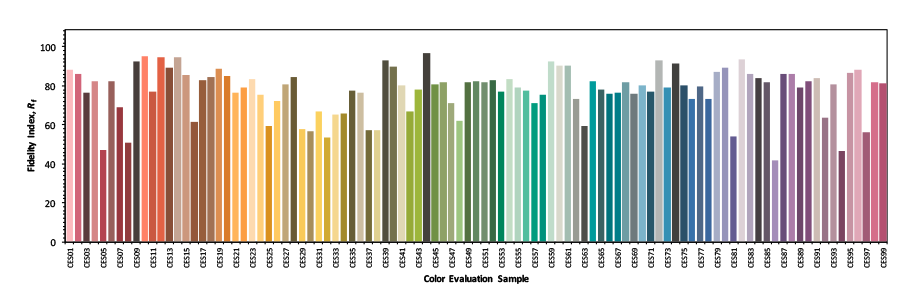
As I’ve already discussed, IES TM-30’s color fidelity metric Rf provides us with as little, or as much, information as we want.  If you just want top line information that the beige office you’re lighting will continue to look beige, you can have it.  An Rf of 78 is probably just fine.  If you want to see the fidelity of each of the 16 hue bins because you’re interested in the fidelity of a particular color range, it’s there.  If you want to know the Rf value of all 99 color samples you can have that, too!  What else?  Well, would you like to see the chromaticity coordinates in (x, y) color space, the SPD vs the reference source, or a pictorial comparison of each of the 99 CES?  No problem.

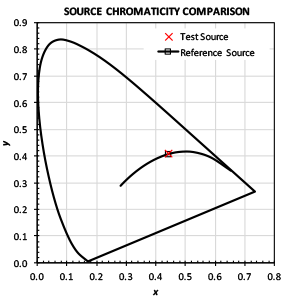
Pretty pictures but are they useful?  Not as useful as the data given above, but lighting designers do like to see this information, even if it’s difficult to interpret.  The CIE 1931 (x, y) color space isn’t perceptually uniform, so the distance we see between the reference source and the test source isn’t very informative.  Seeing the SPD is interesting, but no one can read an SPD and know what the light looks like or how it renders colors.  The CES Chromaticity Comparison is also interesting, but the red and black dots aren’t connected to one another.  With some light sources it’s easy to tell how they relate so we can see chroma and hue shifts, but as Rf drops and color shift increases it gets harder and harder.  What is useful are the next two graphics: the Rf value by Hue Angle Bin and by CES.


Now we can see how individual color ranges are affected by the lamp in question.  This may be especially useful on certain projects were specific color ranges are present and need to be accurately rendered.  The individual CES scores useful for the same reason.  However, in my opinion if you want information at that level of detail you’re probably better off doing a mockup and looking at project specific color and material samples instead of the CES.

TM-30 arms the lighting specifier with as much or as little information as needed on a particular project.  It also provides additional information that may be important (such as Duv).  It then allows the specifier to apply experience and knowledge about the client and the project to determine whether or not a given light source is appropriate.    Who could say no to that?

The Advantages of TM-30

In this series of posts about IES TM-30-15 I’ve discussed the problems with CRI and the resistance to adopting TM-30.  In this post I’ll discuss the advantages of TM-30 over CRI, and what TM-30 is and isn’t.

Color Samples

Like CRI, TM-30 compares color samples rendered by a given test light source and a reference illuminant of the same correlated color temperature (CCT).  The first advantage of TM-30 is the selection of color samples.  CRI uses the eight samples show in Fig. 1, which are selected from the Munsell color system.

Figure 1 Colors used to calculate CRI Ra

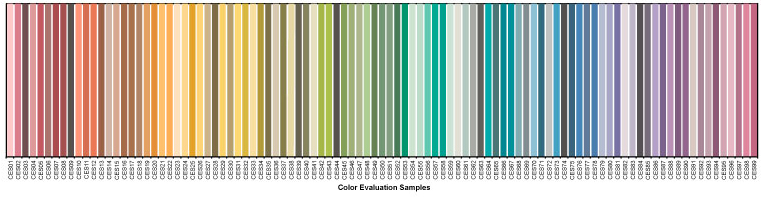
All eight are of medium value and are not evenly distributed across the color space or across the visible spectrum.  This allows lamp manufacturers to “optimize” lamp spectra to score a higher CRI Ra than visual evaluation of the light would indicate.  TM-30 uses the set of 99 color samples shown in Fig. 2.  These color samples range from pale tints to saturated colors, and are drawn from real world objects including textiles, plastics, skin tones, printed materials, natural objects, and paints.

Figure 2 Colors used in the TM-30 calculations

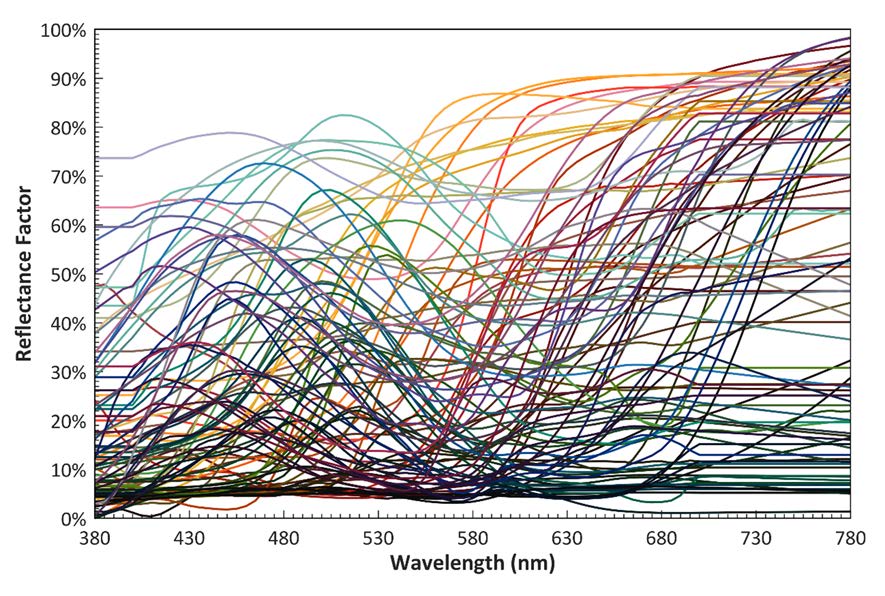
These colors have been selected from a database of about 105,000 objects.  In reducing that number to one that is more manageable, the authors of TM-30 made sure that the color samples were even distributed across the most modern color space (CAM02-UCS) and that their reflectances were evenly distributed across the visible spectrum, as shown in Fig. 3.

Figure 3 Spectral reflectances of the TM-30 color samples

Spectral tuning (gaming the system to achieve a higher score) isn’t possible with these color samples, which means that the resulting scores are honest, and comparisons of light sources are apples-to-apples.

Color Space

The second advantage of TM-30 is the selection of color space.  A color space is a model of a range of possible colors.  In our case we are interested in a color space that encompasses the entire range of visible colors.  CRI uses a color space called CIE 1964 (U*, V*, W*), which is no longer recommended for any other use.  In other words, it’s very outdated.  TM-30, on the the other hand, uses the most up-to-date color space CAM02-UCS.  TM-30 isn’t locked in time, either.  There is a new, more accurate color space under discussion at CIE.  If it is approved, and increases the accuracy of TM-30, I expect it would be included in a future update.

Reference Light Source

Like CRI, TM-30 uses Plankian radiation (blackbody radiator) for lower CCTs and the CIE Daylight (D) Series for higher CCTs for the reference light source.  The difference is that CRI Ra has a pronounced shift at 5000 K from one to the other, resulting in the possibility of a significant shift in Ra values between 4999 K and 5001 K.  TM-30 overcomes this by using a proportional blend of Plankian radiation and the CIE Daylight (D) Series between 4000 and 4999 K, much the way a variable white LED fixture blends LEDs of two different colors to achieve its full range.

Calculation Results

Instead of a single fidelity value, as with CRI Ra, TM-30 give us a wealth of data about the color rendering of the light source in question.  The first is the Fidelity Index Rf.  Like Ra, it is a comparison of the color rendering of the test light source compared to the reference light source.  However, with 99 color samples it is a tougher test that cannot be gamed.  I’ll have more to say about Rf in a future post.

The second is the Gamut Index Rg.  Rg indicates the average change in saturation of the 99 color samples as rendered by the test source compared to the reference source.  I’ll have more to say about Rg in the future, too.

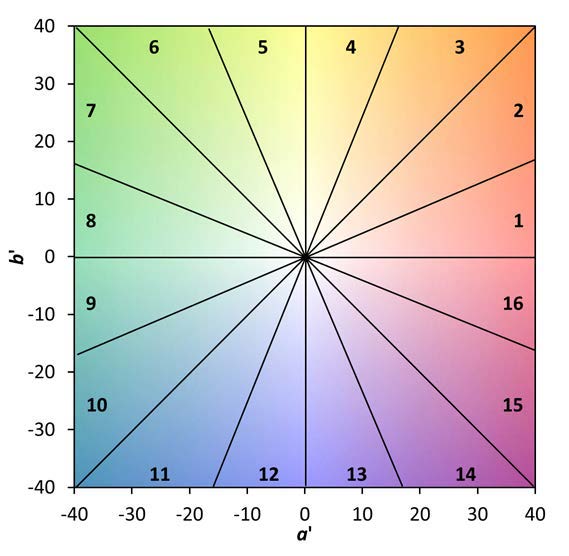
So, from the start TM-30 gives us more information, but it doesn’t stop there.  It also divides the color space into 16 wedges, called hue angle bins, as shown in Fig. 4.  The Rf and Rg values of each bin are also calculated and reported so that if a specifier is interested in the performance of a light source in a particular color range, that information is available.  The information is also presented graphically by showing the average shift of each bin on the same graphic.

Figure 4 TM-30 hue angle bins

In addition, if you really want to dig down deep, the TM-30 calculation tool calculates the Rf and Rg values of the individual 99 color samples.

What TM-30 Is And Isn’t

TM-30 is a calculation procedure that takes an objective and statistical approach to analyzing two aspects of color rendering – fidelity to a reference source, and saturation shift relative to the same reference source.  The calculation also produces information about hue shift, which is presented graphically.  The calculation procedure is a consolidation of years of research by individuals and organizations around the world.  Its authors come from the research, specification,and manufacturing areas of the lighting industry.  Research since its introduction in 2015 has supported its validity as an accurate method of characterizing color rendering.  The CIE has endorsed Rf for scientific use in CIE 224:2017 Color Fidelity Index for accurate scientific use.  Unfortunately, they declined to endorse it for specification or other uses, as I’ve discussed here.  However, quite a few manufacturers see the advantage of TM-30 and are including Rf and Rg information on their cut sheets.

TM-30 isn’t a color rendering guide.  It doesn’t contain recommendations for acceptable values.  It reports calculated values and leaves interpretation of those values to the specifier based on experience and the particulars of the project.  (However, the IES is likely to publish guidance in the future.)  It also doesn’t attempt to evaluate color perception or color preference.  Those two aspects of color are application (and even situation) dependent, so again the specifier will use experience and understanding of the project to determine what values are appropriate and/or acceptable.

TM-30 provides significantly more information about the color rendering of a light source, and the information presented is far more accurate than CRI.  The authors of TM-30, and the IES Color Committee in general, are open to improvements in the calculation and the presentation of its results.  As additional scientific information becomes available, or improved or expanded means of calculation and presenting information are developed, it can be updated as needed or on a regular three to five-year cycle.

Who’s Afraid of TM-30?

As the Co-Chair of the IES Color Committee, I have seen too many statements that full-scale adoption of TM-30 is too difficult and will create confusion in the market.  Often, these assertions come from major manufacturers who want to control market disruption, not be disrupted.  In my professional lifetime there have been, and continue to be, significant changes in the lighting marketplace.  When new products are introduced, designers are told about the wonderful benefits of using them.  There has never been a time when large manufacturers or organizations with loud voices have said the market could not accept about a new product because doing so was too burdensome.  For example,

  • The introduction and transition to electronic ballasts and transformers meant that we had to learn about reverse phase dimming and control protocols.
  • The T5 lamp meant we had to change our layout patterns to accommodate lamps that weren’t standard 2’, 4’, and 8’ lengths.
  • Metal Halide lamps, especially PARS, meant that in exchange for energy savings we had to learn about the color rendering of a new type of lamp, and give up dimming.
  • Daylight harvesting and daylight responsive designs meant we had to learn about daylight zones, photosensors, and daylight harvesting control systems.
  • White LEDs meant we had to learn about another light source and its specific pros and cons, including different color rendering properties due to its SPD.
  • Circadian lighting means we are all in the process of learning how and when to apply the most current scientific evidence to certain project types.  Since the science is constantly advancing on this topic, we must be aware and continue to educate ourselves.
  • Regularly updated energy conservation codes mean that as we begin to memorize the lower LPDs and changes to control and daylighting requirements, we have to relearn that information because it changes every three years.
  • Most recently, we’re supposed to enthusiastically embrace IoT, adding huge complexity to our lighting control systems and opening them up to hacking.

But, I keep hearing that industry adoption of TM-30, allowing specifiers to have a much clearer idea of the color rendering properties of their light sources, is tooo haaaaard!  This is especially maddening when so many professions, including lighting design if you have an LC or LEED credential, require continuing education that is supposed to be more than halfway paying attention to a webinar.

Manufacturers love introducing and promoting new products and technologies that will expand profits, and specifiers get the hard sell all the time.  But some manufacturers don’t want to consider TM-30 for several reasons.  First, there’s the fear that the Rf value, which is analogous to CRI Ra, will be lower than the Ra value.  Even though it’s a different, and tougher, test they fear loss of sales if numbers change.  I suspect the manufacturers who fear this the most are those who have most engineered their spectra to score well on Ra, but know that Rf can’t be gamed in the same way.  Second, as one manufacturer flat out told me, they’d rather put their money into IoT (and other new and profitable products) instead of updating cut sheets and web pages.

Here’s the thing – as a designer and specifier I have no interest in being stuck in 1965 (the year CRI was unveiled) or even 1995 (the most recent update to CRI).  We know that CRI is flawed, we know what the flaws are, and we know that the CIE has been unable to come to consensus on fixing the flaws.  The IES has done a great job of developing a new, accurate, modern tool that gives us so much more information than CRI ever could.  My design decisions, and my ability to learn about my profession so I can be better at it, are not driven by manufacturer profit masquerading as manufacturers worrying about specifier or consumer confusion.  Research over the past two years has shown TM-30 to be more accurate, and we continue to learn more about how to effectively use it.  Lighting specifiers should begin the transition to TM-30 by insisting that manufacturers provide them with Rf, Rg, and color vector graphics.

R.I.P. CRI

It’s been a little over two years since the IES released TM-30-15 IES Method for Evaluating Light Source Color Rendition.  In that time TM-30 has seen growing support in the industry and a growing body of evidence for its accuracy and usefulness.  We’ve nearly reached the moment when we can all agree that it’s time to retire CRI and fully adopt a modern, accurate system of measuring and describing the color rendering of light sources.  What’s wrong with CRI?  Quite a bit, so if you’re not up to date on the issue here’s an overview.

In 1948 The CIE first recommended a color rendering index based on a method developed in 1937.  The 1937 method is a fidelity metric (that is, it compares a test light source to a reference light source) that divides the spectrum into eight bands and compares each band to a full spectrum radiator.  In 1965 the CIE finally adopted CIE 13-1965 Recommended method of measuring and specifying color rendering properties of light sources, based on a test color sample method, what today we call CRI Ra or just CRI.  From the start it was apparent that there were problems.  In 1967 a committee was established to correct for adaptive color shift.  Other problems were uncovered, and in 1974 a formal update was published.  Errors were uncovered in the 1974 edition, resulting in a third version in 1994, which is the version we use today.

So far, so good.  Errors are discovered in the method used and are eventually corrected, so what’s the fuss?  The fuss is that the corrections were minor compared to the scope of the errors, and 23 years after the last correction we still don’t have an accurate, up to date system.  In the early 1990s a proposal to update the formula and test color samples failed to gain consensus.  Two subsequent attempts to improve the metric also closed without adoption.  The current problems, as described in the 2011 IES Lighting Handbook, 10th Edition include:

  • Averaging the color shifts of the eight test colors says nothing about the rendering of any single sample.  A large error in one color can be masked by accurate rendering of the other samples.
  • The test color samples are all of moderate saturation so the index doesn’t reveal color shifts in saturated colors.  In addition, the test colors are not evenly distributed through the color space or the spectrum, so light source spectra can be engineered to score higher than visual observation would indicate.
  • The color space used, the 1964 UCS chromaticity diagram, is no longer recommended for any other use.
  • All chroma shifts are penalized, even though research shows that moderately increasing chroma is desirable in many applications.
  • The chromatic adaptation used has been shown to perform poorly and is no longer recommended for any other use.
  • A single number index gives no information about the direction or extent of color shift for any particular color or color range.

Why haven’t these problems been corrected in the past 23 years?  I’m told that there are two issues.  The small issue is that competing scientific interests on the committee advocate new metrics that they’ve developed as a replacement or supplement to CRI.  The larger problem is that manufacturers on the committee don’t want to see any changes that would reduce the CRI of any of their lamps.  From their perspective, it’s better to have a high score on an inaccurate test than a low score on an accurate one.  It seems that internal politics has been preventing updates, corrections, and improvements.

Although many other color rendering metrics have been proposed over the years, none has been adopted by CIE, which has the most significant voice on this issue.  The result is that the sole internationally accepted metric, which has also been written into product specifications and into codes, is CRI.  That began to change in 2015 with the introduction of TM-30. I’ll have more to say about TM-30 in future posts, but for now let’s agree that CRI Ra is broken and CIE is in no hurry to fix it.  A better system exists, and our industry should adopt it.

IoT Lighting? No Thanks.

The current global cyber-attack, combined with last year’s “denial of service attack has me thinking about the lighting industry and IoT.

It was ironic that last year’s attack happened just days before the IES annual conference, at which IoT lighting was touted as the next big thing that everyone had to adopt or be left behind. You may recall that one aspect of that attack was that hackers recruited IoT devices like thermostats and smoke detectors. Many designers may think, “Well, sure, homeowners don’t have good security, but that wouldn’t happen to one of my corporate clients.” The current attack shows the flaw in that thinking. New tools have allowed hackers access to supposedly secure networks, and not all networks that should be secure (such as Britain’s NHS) actually are.

The question, then, is, “Why should my lighting system use IoT?” I’ve asked several friends in lighting design firms large and small and the answers I’ve received are revealing. Almost no one has a client who is asking for this. (I’ve had exactly one client who wanted the lighting system connected to the corporate LAN.) Do they want lighting systems connected to their BMS? If the client is knowledgeable and the building is large, yes, although today’s lighting systems have so many programming options we don’t need the BMS to control the lighting system. Do they want lighting systems to use Wi-Fi so that users can adjust the lights from phones and pads? Not very often. “Why would I want to give that many people authorization to change the lighting?” is the question asked, and rightly so. Do they want light fixtures with IP addresses and built-in Wi-Fi, Li-Fi, daylight sensors, occupancy sensors, temperature sensors, humidity sensors, and software that tracks shoppers or monitors space usage? “How much will that cost?” is the usual first question, followed by a strong “No.”

If we designers don’t see an artistic or operational advantage to these systems, and if our clients don’t see an advantage and aren’t asking for these systems, why all the noise about them? The answer, of course, isn’t better lighting design or increased energy efficiency, it’s money. Companies like Cisco see expanded profits from embedding Cisco sensors in every light fixture in a building, connecting all of those fixtures to Cisco POE switches and perhaps controlling the fixtures and sensors with Cisco software. Fixture manufacturers, always looking for a way to differentiate their products, jump on board. Marketing departments create hype, magazines and web sites need material, and voila! the next “must have” lighting system feature.

Who’s providing network security? The corporate IT department, I guess. Are the lighting systems vulnerable to hacking? The current and recent attacks tell us the answer is, “Yes.” Are manufacturers of IoT devices investing in security? Not really. They see it as the responsibility of someone upstream. Would anyone want a lighting system that is vulnerable to being turned off in an emergency, or reprogrammed by someone just to see if they can do it? No.

Some of the lighting systems I am designing are quite complex involving hundreds of fixtures with hundreds of addresses, multiple control protocols, and multiple points of control including touchscreens and Wi-Fi devices. One thing no one has to worry about, though, is high-jacking or corruption of the system. Each system stands alone. Software updates, if they are ever needed, are downloaded and installed via a USB key. Anyone wanting access to the system has to be within Wi-Fi range and has to hack the network. What would they get? Access to a single lighting system. There’s almost no reward and therefore there’s almost no incentive. Call me a Luddite if you like, but for now I’m going to stick to designing secure, flexible systems that provide my clients with only the features that they want at a price they are willing to pay. I’m sure that the pressure to “innovate” will eventually lead me to using these IoT systems. But for security’s sake I’m going to resist for as long as I can.

Design Guide for Color and Illumination

As the co-chair of the IES Color Committee I am delighted (pun intended) to announce the publication of the Design Guide for Color and Illumination.  The guide is the result of over five years of work by more than a dozen researchers, engineers, manufacturers, and designers from across the globe.  Here’s part of the description on the IES site.

Color can be described using concrete values such as chromaticity coordinates, spectral power distribution, or others discussed later in this guide. However, one’s response to color can be much more personal and emotional—and therefore more difficult to quantify. This guide takes the reader from basic vision and color vocabulary, through methods of measuring and quantifying color, and culminates in the practical use of commercially available white light and colored lights. The definitions, metrics, and references discussed will assist in building a critical understanding of the use and application of color in lighting.

It is probably the best, most thorough discussion of light and color available today.  Everyone interested in color, color perception, color rendering, and their relationship to light should read it.  It will be available at the IES booth at Lightfair.

Lighting For Plant Health

I have a current project with a green wall, aka living wall, and other greenery in the space. I’ve been given conflicting information about the lighting requirements I need to meet are and how to measure them, so I did some research. This isn’t definitive, but here’s what I’ve found.

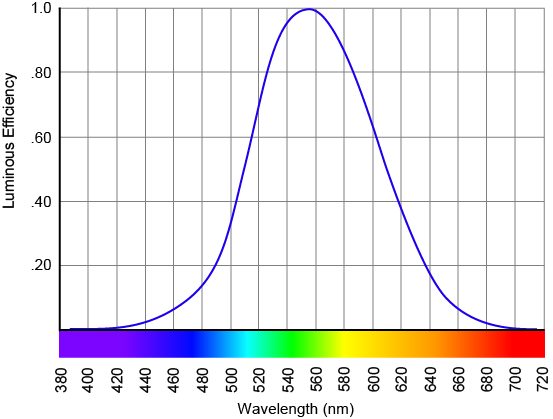
First of all, the measurement units that we’re all familiar with don’t apply to horticulture because the average plant’s response to light is very different from that of the human visual system. We know that the human eye response curve is V(λ) (pronounced vee lambda) which is shown in Figure 1. Our response to electromagnetic energy falls between 380 and 770 nm, with a peak response at 555 nm. In order to measure light the way the human visual system perceived it, V(λ) is folded into the definition of the lumen, the footcandle, etc.
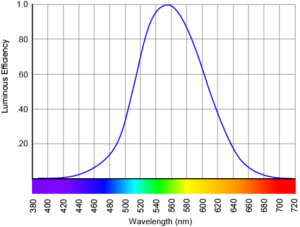
Figure 1 V(λ)

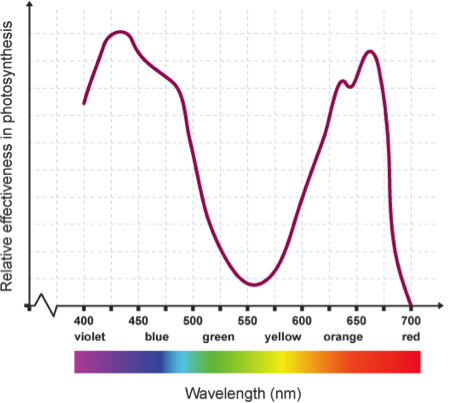
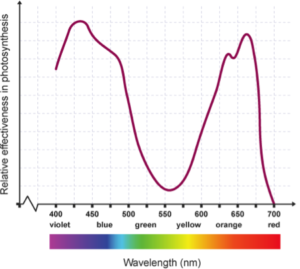
Plants, however, have a response curve called the photosynthesis action spectrum, shown in Figure 2. The wavelengths of light that are absorbed and used by plants are below 520 nm and above 610 nm [i], which roughly equates to the blue and red range of the visible spectrum. Plants need a great deal of red light, a far amount of blue light, and little or no green light.
photosynthetically active spectrum

Figure 2 Average photosynthesis action spectrum of chlorophyll [ii]

So, we can’t talk about the amount of light delivered to plants in a useful way if we’re using lumens and footcandles. The measurement of light for plant health is Photosynthetically Active Radiation (PAR) [iii]. There are PAR calibrated light meters, and digital tools to convert lux/footcandle readings to PAR. Other common measurements are also not relevant to horticulture.

  • Color temperature is a numerical indication of the warmth or coolness of white light, but warmth or coolness are aesthetic criteria and are not relevant in light for plant health.
  • CRI is an indicator of how well a light source allows us to see colors when compared to a reference light source. The response of the human visual system to light is built-in to the CRI calculation. Again, for plant health we are not concerned with seeing the colors of the plants so this metric is not relevant.


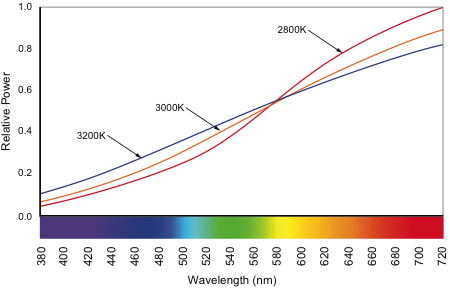
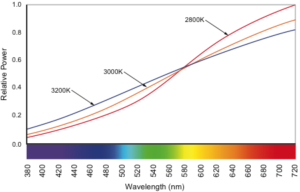
What kind of light should we provide? Incandescent light has an appropriate balance of red and blue light for plant health, as shown in Figure 3. The power consumption will be high. Fortunately, power consumed by the lighting for plant health is exempt from the energy conservation codes. However, with their short life and high power consumption incandescents are, overall, a poor choice.
Incandescent SPD

Figure 3 SPD for incandescent light of 2800 K, 3000 K, and 3200 K [iv]

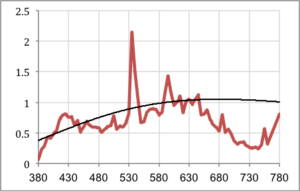
High color temperature metal halide lamps have been the horticulture light source of choice for a long time because their SPD provides an appropriate balance of red and blue light (Figure 4). While metal halide lamps are being replaced by LEDs in many applications, I expect they will be available for at least the next decade. For my project, these fixtures would only to be used during the green wall’s growth period in the morning before the space opens to the public. A second set of fixtures with warmer light will be used when the space is open so that I could light the wall in a way that is in balance with the rest of the space during operating hours.
Metal Halide SPD

Figure 4 SPD for a 4200 K metal halide [v]

One of the exciting features of LEDs is that they permit fine-tuning of the emitted spectrum. With LEDs it is possible to create a light source that closely follows the photosynthesis action spectra. This has been shown to “improve factors such as yield, flavor, color, plant growth, and flowering as well as pest and pathogen management and control.”[[vi] The impact has been studied, and results so far have been positive, for leaf lettuce [vii], cucumbers [viii], and tomatoes [ix], among others. At least one study has noted, however, has “concluded that the response of plants to the applied light is individual and depends on the species,” [x]

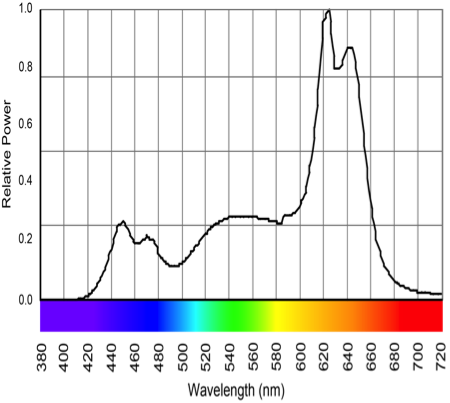
Therefore, an alternative to metal halide fixtures is multi-colored LED fixtures. Since multi-colored LED fixtures allow users to control the brightness of each color individually one could opt for a fixture with a Red, Blue, White (RBW), a Red, Red, Blue, White (RRBW), or a Red, Blue, Blue, White (RBBW) set of LEDs. This would permit one fixture to provide light for health and accent light. One possible result of a RBW fixture is shown in Figure 5. This is a much better match to the photosynthesis action spectra than incandescent, metal halide, or white LEDs.
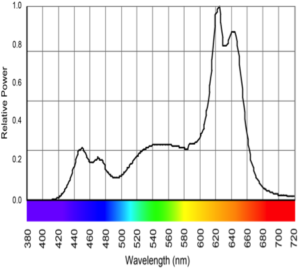
Figure 5 Possible RBW LED produced SPD

For the time being, the people responsible for the greenery have asked me to stay with the tried and true metal halide lamps.  In the near future, as metal halide lamps become rarer, and as LEDs become more common in horticulture, I expect we’ll be changing over to LEDs.


References

[i] Yingchao Xu, Yongxiao Chang, Guanyu Chen, Hongyi Lin, The Research On LED Supplementary Lighting System For Plants, Optik – International Journal for Light and Electron Optics, Volume 127, Issue 18, September 2016, Pages 7193-7201, ISSN 0030-4026, http://dx.doi.org/10.1016/j.ijleo.2016.05.056.

[ii] The Science of Food Production, http://www.bbc.co.uk/education/guides/z23ggk7/revision/2.

[iii] Torres, Ariana P., Lopez, Roberto G., Measuring Daily Light Integral in a Greenhouse, Department of Horticulture and Landscape Architecture, Purdue University, https://www.extension.purdue.edu/extmedia/ho/ho-238-w.pdf

[iv] Livingston, Jason, Designing Light: The Art, Science, and Practice of Architectural Lighting, Hoboken: John Wiley and Sons, 2014.

[v] TM-30-15 Advanced Calculator, Illuminating Engineering Society, New York: Illuminating Engineering Society, 2015.

[vi] Davis, Philip A. and Burns, Claire, Photobiology In Protected Horticulture, Food and Energy Security 2016: 5(4): 223-238. http://onlinelibrary.wiley.com/doi/10.1002/fes3.97/full

[vii] Filippos Bantis, Theoharis Ouzounis, Kalliopi Radoglou, Artificial LED Lighting Enhances Growth Characteristics And Total Phenolic Content Of Ocimum Basilicum, But Variably Affects Transplant success, Scientia Horticulturae, Volume 198, 26 January 2016, Pages 277-283, ISSN 0304-4238, http://dx.doi.org/10.1016/j.scienta.2015.11.014.

[viii] Brazaityte, A., et.al.,  The Effect Of Light-Emitting Diodes Lighting On Cucumber Transplants And After-Effect On Yield, Zemdirbyste, Volume 96, Issue 3, 2009, Pages 102-118. https://www.scopus.com/record/display.uri?eid=2-s2.0-73949144018&origin=inward&txGid=7294EF1D0E6304BAA77C73981961A69E.wsnAw8kcdt7IPYLO0V48gA%3a2 (Login Required)

[ix] Brazaityte, A., et. al., The Effect Of Light-Emitting Diodes Lighting On The Growth Of Tomato Transplants, Zemdirbyste, Volume 97, Issue 2, 2010, Pages 89-98, https://www.scopus.com/record/display.uri?eid=2-s2.0-78249276864&origin=inward&txGid=7294EF1D0E6304BAA77C73981961A69E.wsnAw8kcdt7IPYLO0V48gA%3a7 (Login Required)

[x] Fra̧szczak, B., et. al., Growth Rate Of Sweet Basil And Lemon Balm Plants Grown Under Fluorescent Lamps And Led Modules, Acta Scientiarum Polonorum, Hortorum Cultus, Volume 13, Issue 2, 2014, Pages 3-13, https://www.scopus.com/record/display.uri?eid=2-s2.0-84898647440&origin=inward&txGid=7294EF1D0E6304BAA77C73981961A69E.wsnAw8kcdt7IPYLO0V48gA%3a12 (Login Required)
How Bright Are Colored LEDs?

Measuring and describing the brightness of colored LEDs is an increasingly important part of a lighting designer’s practice. They are used more often, and in more types of projects, than ever before. Yet, we don’t have an accurate method for understanding exactly how much light is being produced and how bright it will appear. It’s a problem that the lighting industry needs to solve, and soon.

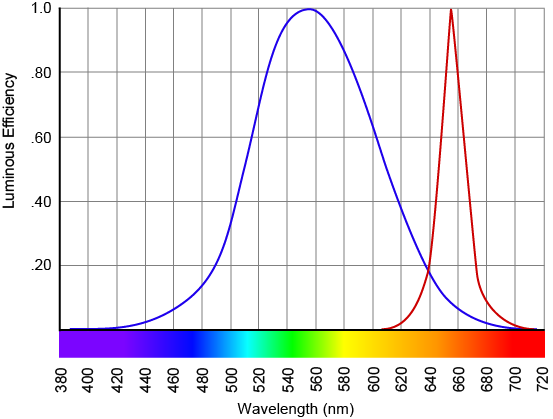
The human eye does not respond to all wavelengths of light equally. We have the greatest response to the yellow-green light of 555 nm. Our response falls off considerably in both directions.  That is, wavelengths of light do not contribute equally to our perception of brightness. The sensitivity curve of the human eye is called V(λ) (pronounced vee lambda) and is shown below.

The definition of a lumen, the measurement of brightness of a light source, is weighted using V(λ) and essentially assumes that the light source emits light across the visible spectrum – in other words, it produces a version of white light.

Light meters are calibrated to measure white light using V(λ) so that their measurement of brightness corresponds with our perception. Individual colored LEDs emit only a fraction of the visible spectrum, as shown below in the graph of V(λ) and the SPD of a red LED, and that’s the problem.

V(λ) and the SPD of a red LED.

Light meters measure the light that the colored LEDs provide, of course, and this information is included on an LED fixture manufacturer’s cut sheets, but it often makes no sense. For example, an RGBW fixture I’ve arbitrarily selected reports the following output in lumens: Red 388, Green 1,039, Blue 85, White 1,498. Since brightness is additive, the output when all LEDs are at full should be 3,010 lumens. However the Full RGBW output is given as 2,805 lumens! That’s 7% lower than what we expect.

The essential problem is that the colored LEDs give the light meter only a fraction of the spectrum it’s designed to measure. The meter provides a result based on its programming and calibration, but the results are often nonsensical or at odds with our perception. This problem doesn’t affect only architectural lighting designers. Film and TV directors of photography and lighting directors also rely on a light meter’s accurate measurement of brightness in their work, and when using colored LED fixtures the light meter is likely to be wrong. In fact, even white light LEDs can be difficult to measure accurately because of the blue spike in their SPD.

For now, the only way to accurately assess the brightness of colored LEDs is to see them in use. Lighting professionals need to let manufacturers and others know that the current situation is not acceptable, and that an accurate method of measuring and reporting the brightness of colored LEDs is a high priority. Talk to fixture and lamp sales reps, fixture and lamp manufacturers, and decision makers at IES, CIE, NIST and other research and standards setting organizations. There’s a solution out there. We need to urge those with the skills and resources to find it to get going!

IES Symposium Summary

If you missed IES Research Symposium III Light + Color you missed an exciting (for color geeks) few days. It would take too long to relate everything that was discussed, but here are some key highlights.

  • TM-30-15 is seeing broader acceptance throughout the industry. In an exciting development, it seems that the CIE is going to endorse TM-30 Rf after a few changes are made. The expectation is that the industry will then begin a rapid movement toward using Rf instead of CRI Ra, and that eventually CRI will be withdrawn. Unfortunately, the CIE is notoriously slow, so there is no timeline for their formal endorsement of TM-30. Maybe next year?
  • Manufacturers are resolving the spectral deficiencies that result from using a limited number of LEDs in both color mixing and color temperature tuning products. Their solution is to move from two and three color systems to systems using four or five independently controlled colors of LEDs.
  • Color preference was a big topic with no resolution. One complaint of both CRI and TM-30 is that they penalize light sources that deviate from the reference source even if many people prefer the deviation. Of course, Ra and Rf are both fidelity metrics, so they must penalize such deviations.   We have strong evidence that people prefer light sources that slightly increase the saturation of objects, and that people prefer light sources that include somewhat more red than the reference sources. However, because the amount of deviation that is preferred is application dependent, a single, all-purpose metric for rating color preference seems to be unattainable.