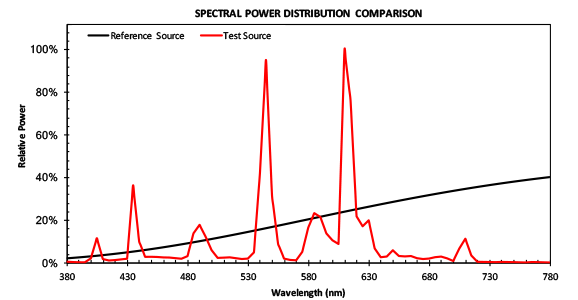
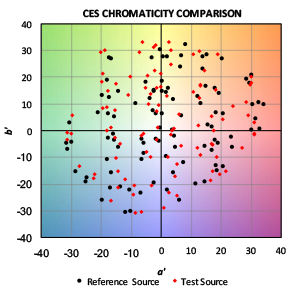
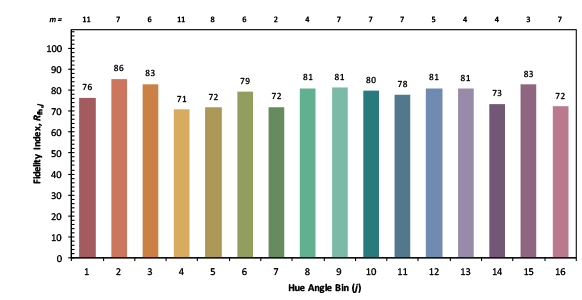
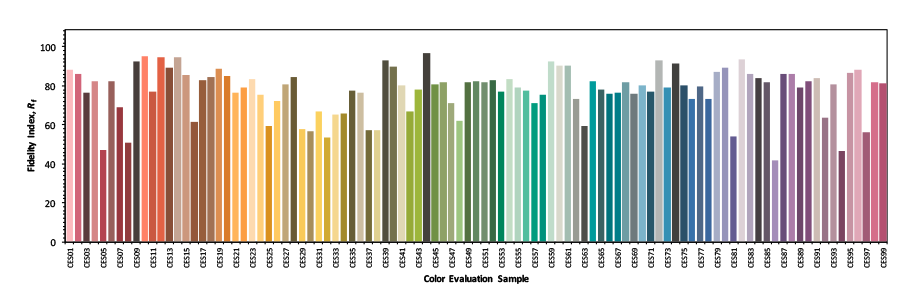
In this series of posts about IES TM-30-15 I’ve discussed the problems with CRI and the resistance to adopting TM-30. In this post I’ll discuss the advantages of TM-30 over CRI, and what TM-30 is and isn’t.
Color Samples
Like CRI, TM-30 compares color samples rendered by a given test light source and a reference illuminant of the same correlated color temperature (CCT). The first advantage of TM-30 is the selection of color samples. CRI uses the eight samples show in Fig. 1, which are selected from the Munsell color system.

Figure 1 Colors used to calculate CRI Ra
All eight are of medium value and are not evenly distributed across the color space or across the visible spectrum. This allows lamp manufacturers to “optimize” lamp spectra to score a higher CRI Ra than visual evaluation of the light would indicate. TM-30 uses the set of 99 color samples shown in Fig. 2. These color samples range from pale tints to saturated colors, and are drawn from real world objects including textiles, plastics, skin tones, printed materials, natural objects, and paints.

Figure 2 Colors used in the TM-30 calculations
These colors have been selected from a database of about 105,000 objects. In reducing that number to one that is more manageable, the authors of TM-30 made sure that the color samples were even distributed across the most modern color space (CAM02-UCS) and that their reflectances were evenly distributed across the visible spectrum, as shown in Fig. 3.
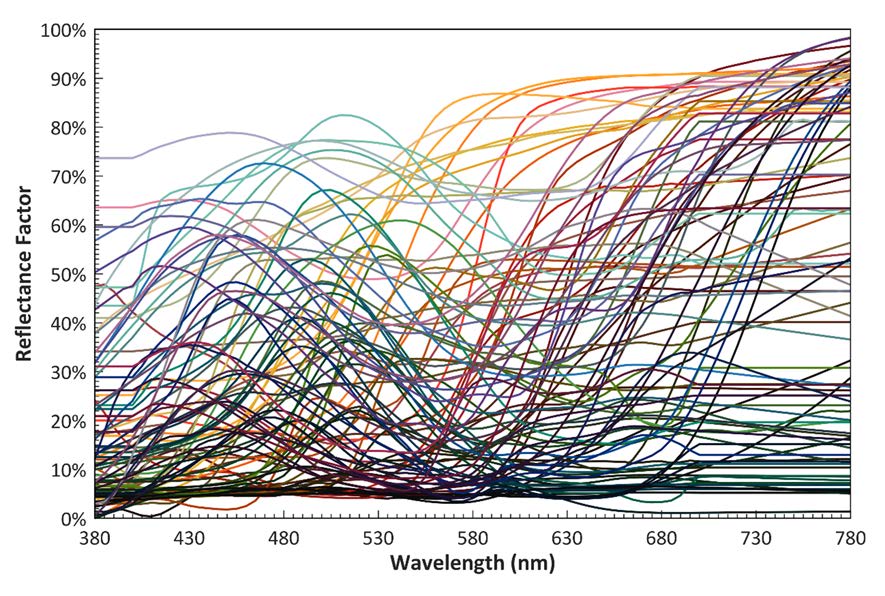
Figure 3 Spectral reflectances of the TM-30 color samples
Spectral tuning (gaming the system to achieve a higher score) isn’t possible with these color samples, which means that the resulting scores are honest, and comparisons of light sources are apples-to-apples.
Color Space
The second advantage of TM-30 is the selection of color space. A color space is a model of a range of possible colors. In our case we are interested in a color space that encompasses the entire range of visible colors. CRI uses a color space called CIE 1964 (U*, V*, W*), which is no longer recommended for any other use. In other words, it’s very outdated. TM-30, on the the other hand, uses the most up-to-date color space CAM02-UCS. TM-30 isn’t locked in time, either. There is a new, more accurate color space under discussion at CIE. If it is approved, and increases the accuracy of TM-30, I expect it would be included in a future update.
Reference Light Source
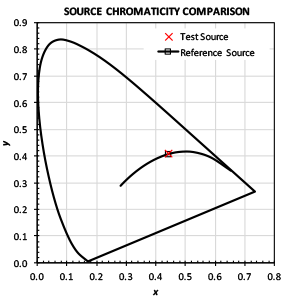
Like CRI, TM-30 uses Plankian radiation (blackbody radiator) for lower CCTs and the CIE Daylight (D) Series for higher CCTs for the reference light source. The difference is that CRI Ra has a pronounced shift at 5000 K from one to the other, resulting in the possibility of a significant shift in Ra values between 4999 K and 5001 K. TM-30 overcomes this by using a proportional blend of Plankian radiation and the CIE Daylight (D) Series between 4000 and 4999 K, much the way a variable white LED fixture blends LEDs of two different colors to achieve its full range.
Calculation Results
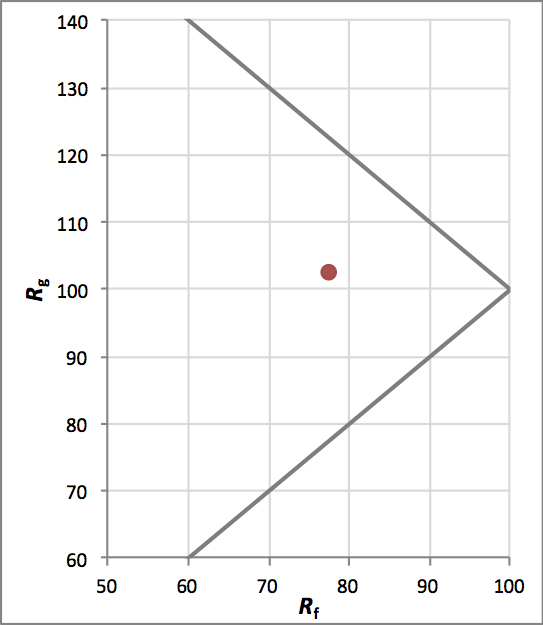
Instead of a single fidelity value, as with CRI Ra, TM-30 give us a wealth of data about the color rendering of the light source in question. The first is the Fidelity Index Rf. Like Ra, it is a comparison of the color rendering of the test light source compared to the reference light source. However, with 99 color samples it is a tougher test that cannot be gamed. I’ll have more to say about Rf in a future post.
The second is the Gamut Index Rg. Rg indicates the average change in saturation of the 99 color samples as rendered by the test source compared to the reference source. I’ll have more to say about Rg in the future, too.
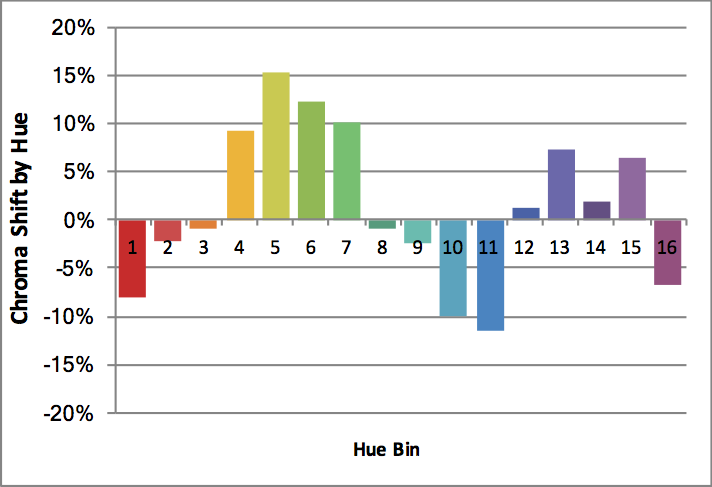
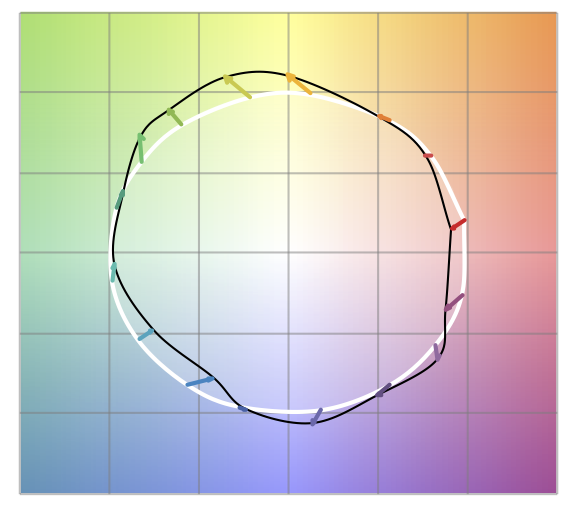
So, from the start TM-30 gives us more information, but it doesn’t stop there. It also divides the color space into 16 wedges, called hue angle bins, as shown in Fig. 4. The Rf and Rg values of each bin are also calculated and reported so that if a specifier is interested in the performance of a light source in a particular color range, that information is available. The information is also presented graphically by showing the average shift of each bin on the same graphic.
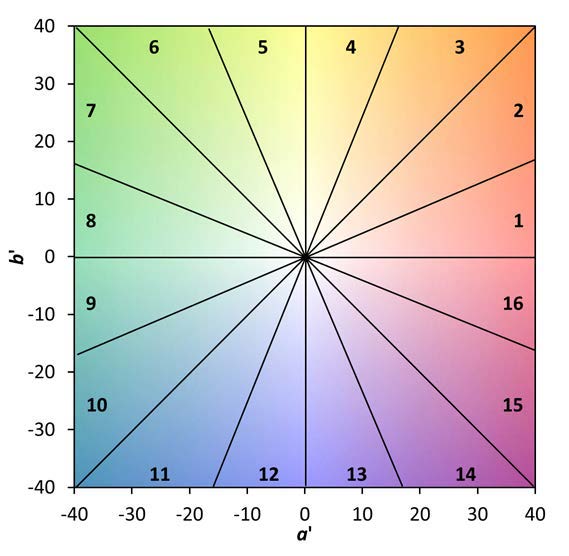
Figure 4 TM-30 hue angle bins
In addition, if you really want to dig down deep, the TM-30 calculation tool calculates the Rf and Rg values of the individual 99 color samples.
What TM-30 Is And Isn’t
TM-30 is a calculation procedure that takes an objective and statistical approach to analyzing two aspects of color rendering – fidelity to a reference source, and saturation shift relative to the same reference source. The calculation also produces information about hue shift, which is presented graphically. The calculation procedure is a consolidation of years of research by individuals and organizations around the world. Its authors come from the research, specification,and manufacturing areas of the lighting industry. Research since its introduction in 2015 has supported its validity as an accurate method of characterizing color rendering. The CIE has endorsed Rf for scientific use in CIE 224:2017 Color Fidelity Index for accurate scientific use. Unfortunately, they declined to endorse it for specification or other uses, as I’ve discussed here. However, quite a few manufacturers see the advantage of TM-30 and are including Rf and Rg information on their cut sheets.
TM-30 isn’t a color rendering guide. It doesn’t contain recommendations for acceptable values. It reports calculated values and leaves interpretation of those values to the specifier based on experience and the particulars of the project. (However, the IES is likely to publish guidance in the future.) It also doesn’t attempt to evaluate color perception or color preference. Those two aspects of color are application (and even situation) dependent, so again the specifier will use experience and understanding of the project to determine what values are appropriate and/or acceptable.
TM-30 provides significantly more information about the color rendering of a light source, and the information presented is far more accurate than CRI. The authors of TM-30, and the IES Color Committee in general, are open to improvements in the calculation and the presentation of its results. As additional scientific information becomes available, or improved or expanded means of calculation and presenting information are developed, it can be updated as needed or on a regular three to five-year cycle.

