![]()
I’m interviewed on this week’s Get A Grip On Lighting podcast. You can listen, watch on YouTube, and more here.
The companion blog to the books Designing With Light and Fundamentals of Energy Efficient Lighting and Controls
![]()
I’m interviewed on this week’s Get A Grip On Lighting podcast. You can listen, watch on YouTube, and more here.
ANSI C78.377 is the publication from National Electrical Manufacturer’s Association (NEMA) that defines correlated color temperatures (CCTs) for LEDs. C78.377 has defined 10 CCTs (2200, 2500, 2700, 3000, 3500, 4000, 4500, 5000, 5700, and 6500 K). The recently released 2024 update adds definitions for CCTs of 2000 K and 1800 K for some outdoor and special indoor applications.
Earlier this month, CIE published CIE Position Statement on Color Quality Metrics, in which it recommends the lighting industry transition from the outdated and sometimes inaccurate General Color Rendering Index (CRI) to the General Color Fidelity Index (Rf ) defined in CIE 224:2017. The position statement notes that problems with CRI (which we’ve known about for years) include use of an outdated color space (CIE 1960 (u, v)), the small number of samples used to calculate CRI (only 8), and that CRI has proven to be especially problematic in evaluating narrow band emitters.
The good news is that CIE is finally recommending retiring CRI from use (which was last updated over 50 years ago in 1974) and adopting a modern, accurate metric for evaluating fidelity for all lighting applications. That’s a huge step forward for the lighting industry.
The less good news is that it stops there. The position statement acknowledges that fidelity is not the only aspect of color rendering, and that studies have shown preferences for light sources that slightly enhance saturation (and therefore reduce fidelity). However, it makes no mention of other metrics (such as ANSI/IES TM-30’s Gamut Index and Preference Design Intent) that address the issue. Since CIE 227’s Rf and TM-30’s Rf are identical, I see this as a belated endorsement of Rf as a fidelity metric and of TM-30 in general. My hope is that this spurs the industry to greater adoption of TM-30, especially for its evaluation of color preference, vividness, and fidelity described in Annex E.
One side note: Rf as defined in CIE 227 is Rf as defined in TM-30. In fact, TM-30 was published two years before CIE 227, which was a response to TM-30. In evaluating TM-30, CIE found that there were a few places where CIE and IES chose different methods of extrapolating certain information. Since CIE had formalized their procedures and IES had not, the two organizations worked together to harmonize their calculations into one calculation that is used in both systems. It’s frustrating that the CIE position statement reads as if CIE developed Rf out of whole cloth, rather than as a response to TM-30 and a mutual refinement of the Rf calculation.
At this point no one should be specifying fluorescent lamps except in extremely specific situations (for example, I recently specified linear fluorescents and linear LED retrofit lamps in a themed environment set in the 1970s). Why? Not only are LEDs more energy efficient, but more bans go into effect today prohibiting the sale of fluorescent lamps, including the following:
California: Compact Fluorescent (CFL) lamps with pin-bases and linear fluorescent lamps. Note that a screw base CFL ban is already in effect.
Colorado: CFL screw-base lamps, CFL pin-base lamps, and linear fluorescent lamps.
Hawaii: CFL screw-base lamps.
Minnesota: CFL screw-base lamps.
Oregon: CFL pin-base lamps and linear fluorescent lamps.
Note that a screw base CFL ban is already in effect.
Rhode Island: CFL pin-base lamps and linear fluorescent lamps. Note that a screw base CFL ban is already in effect.
For additional information LEDvance has a table of bans, current and future, for all states and Canada here.
If you look up the definition of Correlated Color Temperature (CCT) in IES LS-1 you’ll find, “The absolute temperature of a blackbody whose chromaticity most nearly resembles that of the light source.” It seems straightforward. The spectra of non-incandescent light sources don’t exactly match a blackbody radiator. They’ll plot off the blackbody locus in a chromaticity diagram. A CCT calculation identifies the color temperature closest to the light source in question – that’s the CCT. We all know that.
Not long ago someone on the IES Color Committee suggested that we develop and issue a standardized CCT calculation. My first thought was, “What? Are you saying that after decades of specifying CCT there’s no industry standard calculation method? What’s going on?” It turns out that since the late 1930s at least a dozen CCT calculation methods have been developed but none of them have been adopted by a standards setting body like the IES or CIE. The same is true for Duv, the direction and distance between the chromaticity coordinates of the light source and the nearest point on the blackbody locus. This means that the method used is up to the LED or equipment manufacturer, and can vary from one manufacturer to another.
Now, for lighting designers this isn’t a problem. Variations between the calculation methods generally aren’t large (although they can range from less than 1/1000th to several hundred K), and we are selecting LEDs described by their nominal CCT as outlined in NEMA C78.377, not their exact CCT. Those chromaticity quadrangles are huge, roughly 400 – 500 K wide and over 7 MacAdam ellipses, as shown below. For lighting designers the problem is the huge variation possible within a single CCT designation, but that’s for another day.

But, for LED manufacturers, testing equipment manufacturers, and researchers this can be a real problem. If two people attempt to precisely measure the same LED and arrive at two different CCTs how would they determine who’s right, or which calculation is “better”?
Now we have an answer. ANSI/IES TM-40 IES Method for Determining Correlated Color Temperature (CCT) and Distance from the Planckian Locus of Light Sources describes a CCT calculation method with an error of less than 0.1 K that calculates Duv based on the result of the CCT calculation. While there’s no way to compel anyone to use this method, it is an American National Standard developed under the ANSI process, making it the closest thing we have to an industry standard. Finally.
We’re now up to 14 states and Canada that have enacted one or more restrictions or bans on mercury containing lamps. Some of the bans are already active, while others go into effect as early as January 1, 2025. LEDVANCE is maintaining a list on their website along with other helpful resources.
The big fluorescent news last week was that Minnesota has become the ninth state to pass a phase out of fluorescent lamps (the others are California, Colorado, Hawaii, Maine, Oregon, Rhode Island, Vermont, and Washington). Minnesota’s timeline is aggressive – screw-based compact fluorescent lamps will be banned from sale six months from now, starting on January 1, 2025. Other fluorescent and mercury vapor lamps will be banned from sale beginning January 1, 2026.
The Minnesota House of Representatives has an information sheet about the new law here. What’s interesting is that the first topic is about reducing the hazard of exposure to mercury, not increasing energy efficiency. It’s not wrong, just curious. The information sheet then goes on to address reduced CO2 emissions, electricity savings, and reduced power plant mercury emissions.
Illinois also has fluorescent banning legislation working through the legislature, so by the end of the year we may see 10, 11 or more states that are phasing out fluorescents.
The Minamata Convention on Mercury, a program of the United Nations with delegates from at least 150 countries, is dedicated to improving global health by phasing out the use of mercury in manufacturing, banning new mercury mines, and limiting mercury emissions. Last month, 147 countries (out of a global total of 195) agreed to phase out florescent lighting globally and completely by 2027.
According to the appliance efficiency non-profit, CLASP, the phase out will, between 2027 and 2050:
Early fluorescent lamps were being tested by Thomas Edison and Nicola Tesla in the 1890s, but it took several advances before they were ready for commercial use around the 1940s. According to the Department of Energy, by 1951 more light was being produced in the US by fluorescent lamps than by incandescent lamps. But, this always came at a cost. Fluorescent lamps work by passing an electric current through gaseous mercury, which emits ultraviolet light, which in turn is converted to visible light by the phosphors that line the fluorescent tube. When discarded (and eventually broken) the mercury would enter the environment, which is why the EPA began encouraging fluorescent lamp recycling and mercury recovery in the mid-2000s. Mercury is a neurotoxin, and symptoms of prolonged and/or acute exposures include:
So, after around 70 years as the dominant commercial light source, and 10 years of decline after the introduction of LEDs, the fluorescent lamp has joined kerosene, whale oil, and others as an historical or legacy light source.
We’ve known for a while that the day was coming, and now it’s here. Effective yesterday retailers will no longer be permitted to sell most incandescent lamps (which includes halogen lamps) in the U.S. There are some exceptions for things like bug lights, but not many.
Replacement lamps for sale now must produce at least 45 lumens per watt, which is easily achieved by LEDs but impossible with incandescents.
The Department of Energy estimates that consumers will save about $3 billion per year. ( Of course, this assumes they buy quality lamps that don’t fail within a year, which is a real problem with off brand, and even some name brand, lamps.)
Source: New Energy Efficiency Rules Ban Incandescent Light Bulbs: What to Know – The New York Times
As part of the conversation around Diversity, Equity, Inclusion, and Respect there’s been a lot of discussion about color rendering and skin tone. I recently heard one speaker say something like, “We know that historical SPDs are racist.” I don’t think that’s accurate or helpful. Here’s why.
Since the development of the fluorescent lamp, the first priority for lamp manufacturers has been maximizing efficacy – getting the most lumens per watt. That’s still largely true today, even though LEDs are so efficient that there’s a lot of room for other considerations. An exclusive focus on efficacy inevitably results in poor color rendering, so the second priority has been acceptable (not maximized) color rendering. In other words, manufacturers have tried to find the right balance between efficacy and quality, but they emphasize efficacy.
When evaluating color rendering, manufacturers only look at the numbers. Whether it’s a calculation of CRI, Rf, Rg, or something else, it’s all done mathematically. There’s no interest in comparing the calculated values with empirical observations. The eight colors used to calculate CRI are a limited range that don’t include a representation of skin, as shown below.

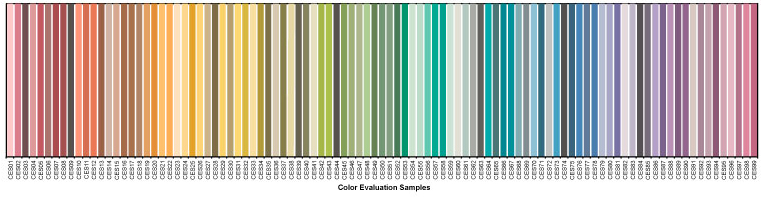
The 99 colors used for TM-30 calculations span the color space and are not weighted toward any hue, tint, or value, as shown below.
So, there’s never been a focus on caucasian skin tone to the detriment of others because skin tone isn’t part of the evaluation.
Does that mean that all skin tones are rendered equitably? Honestly, we don’t know. On one hand, there’s no reason to think that we evaluate skin tone differently than we evaluate other surfaces. It’s reasonable to expect that a high fidelity source, for example, that give cars, apples, and kittens a good color appearance will do the same for human skin.
On the other hand, we don’t have good studies to confirm that. It may be that we hold different criteria for evaluating skin than we do for apples, resulting in the need for a separate skin tone rendering metric. Again, today we just don’t know.
In fact, the IES Color Committee is looking at this right now. We’ve started with an effort to gather as many studies as we can find – though there are very few that focus on skin rendering. The next step is to evaluate the literature to determine if additional study is needed, and what such a study (or studies) would require and evaluate. The hard part is funding the studies, and that would be the next step. Eventually, we’d have some solid science from high quality studies that would tell us if skin tone is evaluated differently than other surfaces, and if so what the calculation of a skin tone metric should include. The goal is to use the appropriate TM-30 measures (remember, there are 149 of them) to evaluate skin tone rendering, and to add a skin tone metric (maybe Rs) to TM-30, if needed.
If you’re interested in joining the task group looking at this, please contact me.