As we know, CRI Ra and TM-30 Rf are both measurements of color fidelity. That is, they compare a test light source to a known reference light source and measure how well the test source matches the reference source. One of the many shortcomings of CRI Ra is that it provides us with a single value. That single value is easy to use, but doesn’t tell us anything about what colors will have increased saturation, decreased saturation, hue change, or will be unaffected.
TM-30 is a tougher test than CRI, so how do Rf and Ra values relate? Lamps with Ra values below about 70 tend to have higher Rf values, while lamps with higher Ra values tend to have reduced Rf values. Of course, this doesn’t mean that the lamps we think of as better have suddenly become worse, it’s just that we’re scoring on a different scale. This means that we can’t draw direct comparisons. For example, Energy Star requires that lamps have a minimum CRI Ra of 80, but that doesn’t mean that they should also have a minimum Rf of 80. Different tests give different results and we have to be careful not to apply the meaning of one to the scores of the other.
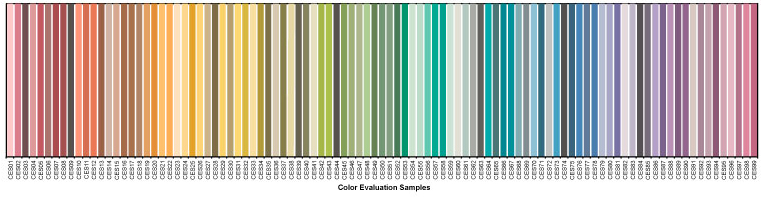
IES TM-30’s Rf mathematically compares the appearance, under a test light source, of 99 color evaluation samples (CES) that are derived from real world objects, to the CES appearance under a reference light source of the same CCT. The distance of the color shift for each CES is measured in the CAM02-UCS color space and averaged. Throw in a lot of calculus (which we don’t need to get into) and voila, the Rf value. It’s important to remember that what we get is just a number. TM-30 doesn’t qualify any of the results as good or bad, desirable or undesirable. It presents information to the lighting specifier and allows the specifier to apply education, professional experience, and knowledge about the project to determine whether or not a given light source is appropriate.
As with Ra, the single value of Rf conveys limited information. It is more accurate, but still only tells us the average match or mismatch between the two light sources. What makes TM-30 so powerful and useful is that it tells us much more if we want to know. For example, using the Calculation Tool that can be downloaded with the purchase of TM-30 (which I wish the IES would make freely available), we can see that one common F32T8/830 has the following characteristics:
Rf 78
Rg 102
CCT 2943
Duv 0.0014
Ra 85
This lamp has moderately good fidelity (Rf), a slight increase in saturation (Rg), has a CCT of just under 3000K, and is slightly above the black body locus and therefore is slightly green (Duv). The Advanced Calculation Tool tells us that the R9 value is 2 and that the Rf for skin is 85. It also tells us the (x, y), (u, v), and (u’, v’) chromaticity coordinates (which, frankly don’t mean anything to me, but the information is there). This information is immediately useful and isn’t provided as part of the CRI calculation. In addition, most light source manufacturers don’t tell us the Duv, although understanding it is becoming increasingly important, especially now that NEMA has extended the chromaticity bins for LEDs in ANSI/NEMA C78.377 American National Standard for Electric Lamps – Specifications for the Chromaticity of Solid-State Lighting Products. That’s a post for another time.
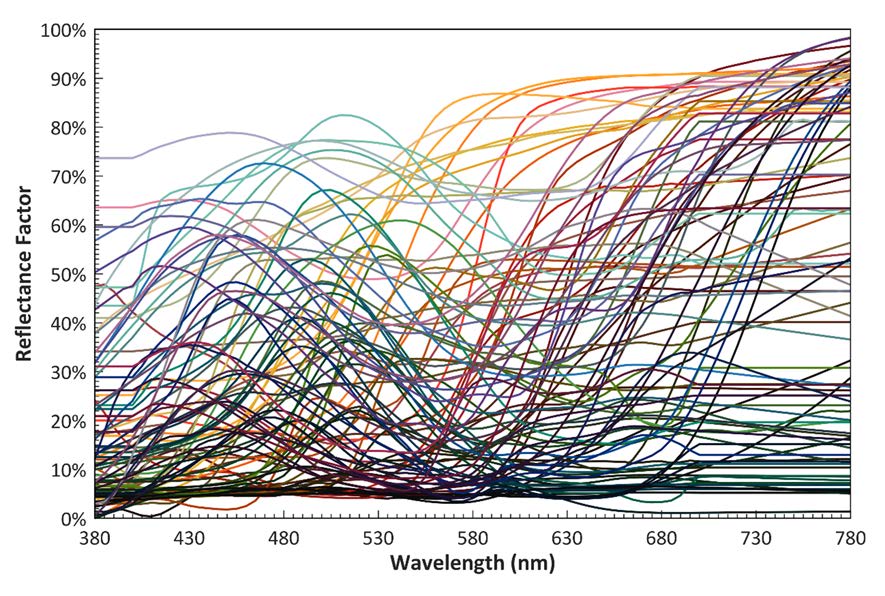
As I’ve already discussed, IES TM-30’s color fidelity metric Rf provides us with as little, or as much, information as we want. If you just want top line information that the beige office you’re lighting will continue to look beige, you can have it. An Rf of 78 is probably just fine. If you want to see the fidelity of each of the 16 hue bins because you’re interested in the fidelity of a particular color range, it’s there. If you want to know the Rf value of all 99 color samples you can have that, too! What else? Well, would you like to see the chromaticity coordinates in (x, y) color space, the SPD vs the reference source, or a pictorial comparison of each of the 99 CES? No problem.
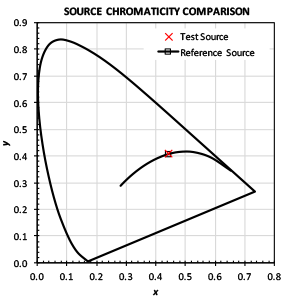
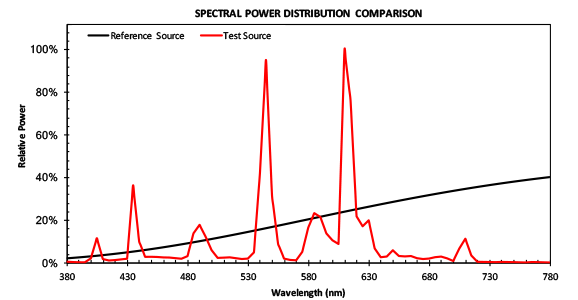
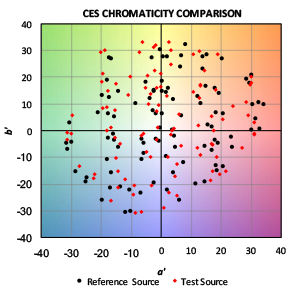
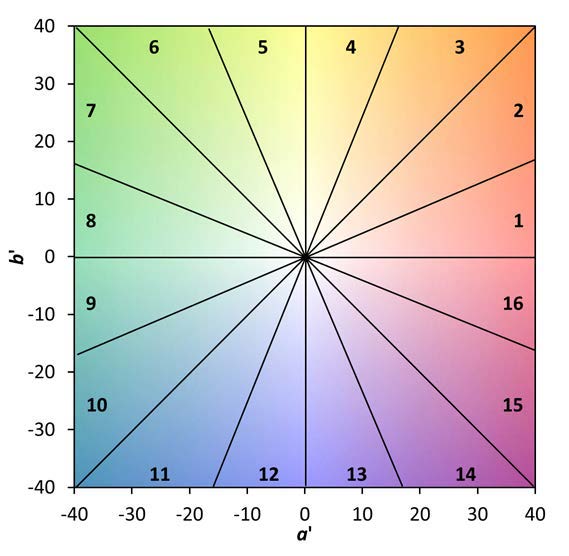
Pretty pictures but are they useful? Not as useful as the data given above, but lighting designers do like to see this information, even if it’s difficult to interpret. The CIE 1931 (x, y) color space isn’t perceptually uniform, so the distance we see between the reference source and the test source isn’t very informative. Seeing the SPD is interesting, but no one can read an SPD and know what the light looks like or how it renders colors. The CES Chromaticity Comparison is also interesting, but the red and black dots aren’t connected to one another. With some light sources it’s easy to tell how they relate so we can see chroma and hue shifts, but as Rf drops and color shift increases it gets harder and harder. What is useful are the next two graphics: the Rf value by Hue Angle Bin and by CES.
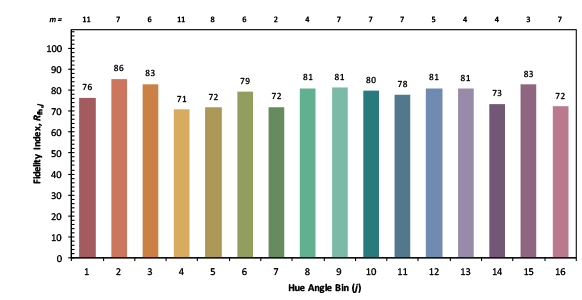
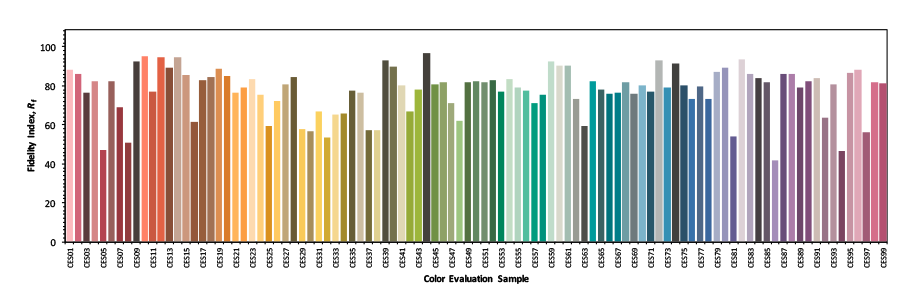
Now we can see how individual color ranges are affected by the lamp in question. This may be especially useful on certain projects were specific color ranges are present and need to be accurately rendered. The individual CES scores useful for the same reason. However, in my opinion if you want information at that level of detail you’re probably better off doing a mockup and looking at project specific color and material samples instead of the CES.
TM-30 arms the lighting specifier with as much or as little information as needed on a particular project. It also provides additional information that may be important (such as Duv). It then allows the specifier to apply experience and knowledge about the client and the project to determine whether or not a given light source is appropriate. Who could say no to that?