Last Thursday Donald Trump spoke to a group of Republicans in Baltimore. One of the things he said caught my attention: “The lightbulb. People said what’s with the lightbulb? I said, here’s the story. And I looked at it, the bulb that we’re being forced to use, No. 1, to me, most importantly, the light’s no good. I always look orange. And so do you. The light is the worst.”
Now, I’m not aware of being made to look orange under LEDs, nor have I ever noticed LEDs making my friends, colleagues, or students appear orange. You can’t imagine how embarrassed I’d be if it turned out that a real estate developer and entertainer had more astute color perception than me, a lighting designer and Co-Chair of the IES Color Committee. If our only means of evaluating the color rendering of a light source, and evaluating the orange content specifically, was CRI we would have no objective way of testing his statement. CRI, technically Ra, is a single value that gives us an average of the match between the light source in question and its reference source (either a blackbody radiator or a CIE definition of daylight, depending on CCT) using only eight color samples.

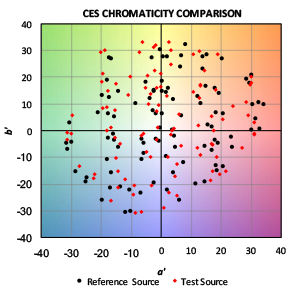
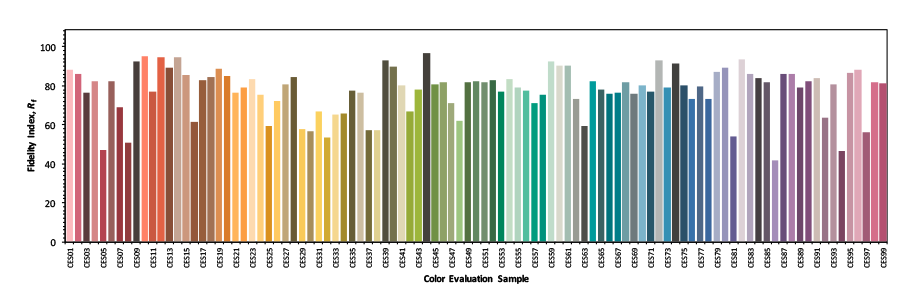
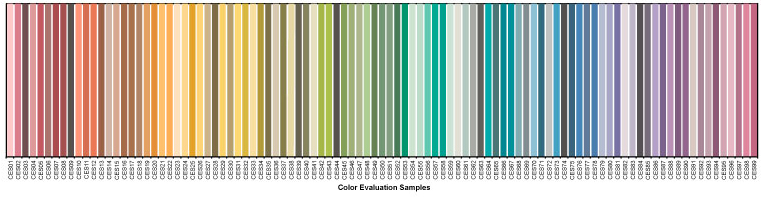
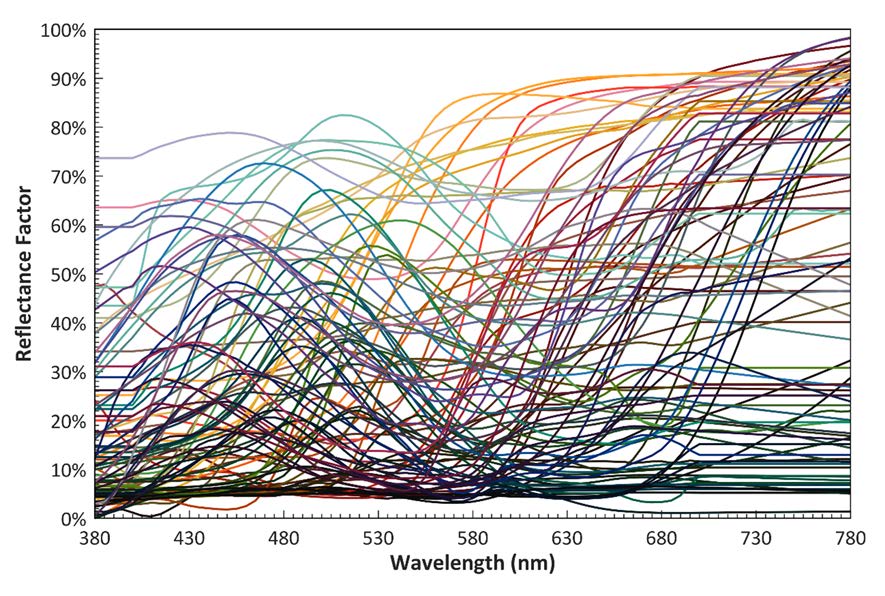
Since Ra is an average value there’s no way to understand the rendering of any particular hue. I’ve talked about this here. However, one of the wonderful things about ANSI/IES TM-30 IES Method for Evaluating Light Source Color Rendition is that we can use it to test that claim. TM-30 uses 99 color samples that are distributed across the color space and the visible spectrum.
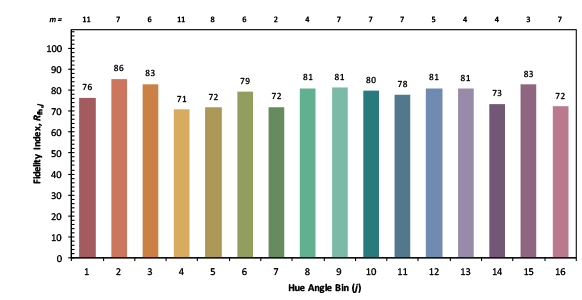
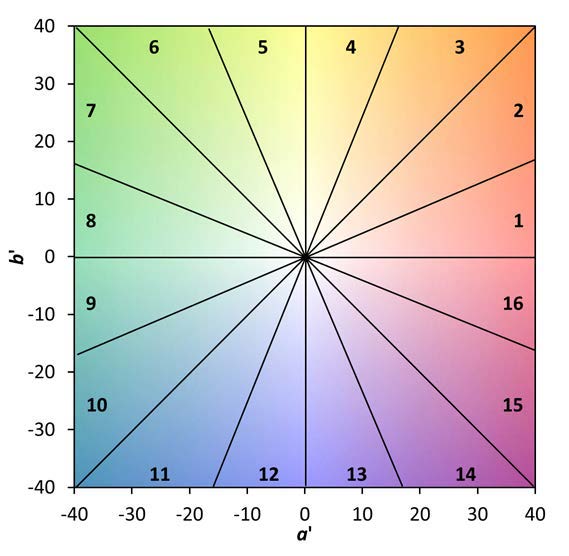
It also breaks the color space up onto 16 Hue Bins, each one covering a specific range of the color space. In the case of orange, we want to look at Hue Bin 3. Specially, we want to look at Rcs,h3 (the subscript CS stands for Chroma Shift) which quantifies the increase or decrease in the saturation or vividness of orange compared to the reference light source.
So, let’s put the science of TM-30 to work and see if we really do know that LEDs make us look orange!
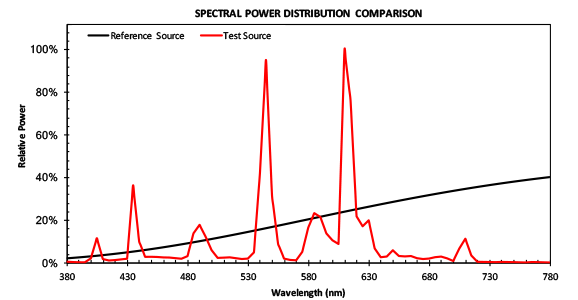
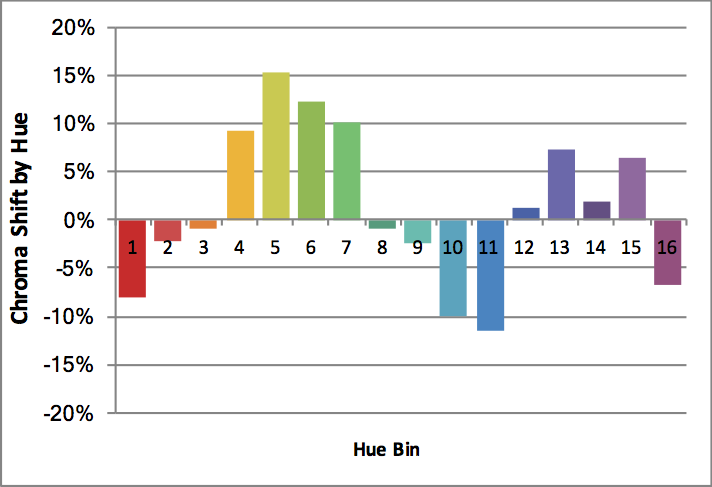
The TM-30 calculator contains a library of 300 SPDs (spectral power distributions), of which 137 are commercially available white LEDs. The CCTs range from 2776 K to 6123 K. If white light LEDs really did make us look orange we’d expect to see a large majority of them have a positive Rcs,h3, probably with an average chroma shift in excess of 10%. In fact, the 137 SPDs have Rcs,h3 that range from -8% to 1% with an average of -3.6%, a decrease (not an increase) in the saturation of orange. It’s not me, it’s him. TM-30, which uses the most modern models of human vision and a set of colors that cover the color space and visible light spectrum, proves it. What a relief!
Don’t believe me? Download TM-30 and the calculator for free from the IES web site and see for yourself.
Of course, I’m not saying LEDs are perfect light sources. Like any other product there are good ones and bad ones. However, TM-30’s measurements of fidelity and gamut (as averages) and measurements of fidelity, chroma shift, and hue shift (by hue bin) permit us to make a thorough evaluation of a light source to understand its color rendering characteristics. Using this knowledge, we can determine if a particular light source distorts colors and is appropriate for a project, or not.
I should take a moment to note another error he made when he said, “And very importantly—I don’t know if you know this—they have warnings. If it breaks, it’s considered a hazardous waste site. It’s gases inside.” Perhaps you’ve heard the acronym SSL or the phrase solid state lighting. LEDs are a version of SSL, which means that they are…well, solid. Unlike previous light producing technologies LEDs are a solid combination of materials. As such, if one were to physically break (which is unlikely since LEDs are small, are mounted to a heat sink and often covered with a lens, so you’d have to break a lot of materials simultaneously) no gas, hazardous or benign, is emitted. He’s thinking of fluorescent lamps and the small amount of mercury they contain. Even then, a broken fluorescent lamp doesn’t turn the area into a” hazardous waste site.” Here are the EPA’s instructions for cleaning up a broken fluorescent lamp.