Standard 189.1 Now Includes TM-30 Requirements

Yesterday an addendum to ANSI/ASHRAE/ICC/USGBC/IES Standard 189.1-2017 Standard for the Design of High-Performance Green Buildings was published. The addendum makes changes to Section 8.3.5, which covers lighting. One of the biggest changes is to add TM-30 color rendition criteria to the section on Indoor Lighting Quality. Here’s the relevant text:

8.3.5.3 Color Rendition. At least 95% of lighting power of nominally white lighting within each enclosed space shall be provided by luminaires that meet the following criteria at full light output in accordance with IES-TM-30, Annex E, P2 and F3:
1. Rf of at least 85
2. Rf,h1 of at least 85
3. Rg of at least 92
4. Rcs,h1 of at least -7% but no greater than +19%

Nominally white lighting is lighting that has chromaticity within the basic or extended nominal color correlated temperature (CCT) specifications of ANSI C78.377.

Where a lighting system is capable of changing its spectrum, it shall be capable of meeting the color rendition requirements within each nominal CCT of 2700 K, 3500 K, 4000 K, and 5000 K, as defined in ANSI C78.377, that the system is capable of delivering.

I hope that this is going to put more pressure on manufacturers to improve the color rendering of their luminaires as measured by TM-30, not CRI, and to provide TM-30 information on their cut sheets. If not, they’ll risk not being considered on projects that have TM-30 requirements.

Do LEDs Make You Look Orange?

Last Thursday Donald Trump spoke to a group of Republicans in Baltimore.  One of the things he said caught my attention: “The lightbulb. People said what’s with the lightbulb? I said, here’s the story. And I looked at it, the bulb that we’re being forced to use, No. 1, to me, most importantly, the light’s no good. I always look orange. And so do you. The light is the worst.”

Now, I’m not aware of being made to look orange under LEDs, nor have I ever noticed LEDs making my friends, colleagues, or students appear orange.  You can’t imagine how embarrassed I’d be if it turned out that a real estate developer and entertainer had more astute color perception than me, a lighting designer and Co-Chair of the IES Color Committee.  If our only means of evaluating the color rendering of a light source, and evaluating the orange content specifically, was CRI we would have no objective way of testing his statement.   CRI, technically Ra, is a single value that gives us an average of the match between the light source in question and its reference source (either a blackbody radiator or a CIE definition of daylight, depending on CCT) using only eight color samples. 

Colors used to calculate CRI Ra

Since Ra is an average value there’s no way to understand the rendering of any particular hue. I’ve talked about this here. However, one of the wonderful things about ANSI/IES TM-30 IES Method for Evaluating Light Source Color Rendition is that we can use it to test that claim.  TM-30 uses 99 color samples that are distributed across the color space and the visible spectrum. 

TM-30 99 color evaluation samples (CES)
TM-30 CES spectral reflectance functions

It also breaks the color space up onto 16 Hue Bins, each one covering a specific range of the color space.  In the case of orange, we want to look at Hue Bin 3.  Specially, we want to look at Rcs,h3 (the subscript CS stands for Chroma Shift) which quantifies the increase or decrease in the saturation or vividness of orange compared to the reference light source.  

TM-30 hue bins
Example of TM-30 chroma shift bar graph by hue bin

So, let’s put the science of TM-30 to work and see if we really do know that LEDs make us look orange!

The TM-30 calculator contains a library of 300 SPDs (spectral power distributions), of which 137 are commercially available white LEDs.  The CCTs range from 2776 K to 6123 K.  If white light LEDs really did make us look orange we’d expect to see a large majority of them have a positive Rcs,h3, probably with an average chroma shift in excess of 10%.  In fact, the 137 SPDs have Rcs,h3 that range from -8% to 1% with an average of -3.6%, a decrease (not an increase) in the saturation of orange.  It’s not me, it’s him.  TM-30, which uses the most modern models of human vision and a set of colors that cover the color space and visible light spectrum, proves it.  What a relief!  

Don’t believe me?  Download TM-30 and the calculator for free from the IES web site and see for yourself.

Of course, I’m not saying LEDs are perfect light sources. Like any other product there are good ones and bad ones. However, TM-30’s measurements of fidelity and gamut (as averages) and measurements of fidelity, chroma shift, and hue shift (by hue bin) permit us to make a thorough evaluation of a light source to understand its color rendering characteristics. Using this knowledge, we can determine if a particular light source distorts colors and is appropriate for a project, or not.

I should take a moment to note another error he made when he said, “And very importantly—I don’t know if you know this—they have warnings. If it breaks, it’s considered a hazardous waste site. It’s gases inside.”   Perhaps you’ve heard the acronym SSL or the phrase solid state lighting.  LEDs are a version of SSL, which means that they are…well, solid. Unlike previous light producing technologies LEDs are a solid combination of materials.  As such, if one were to physically break (which is unlikely since LEDs are small, are mounted to a heat sink and often covered with a lens, so you’d have to break a lot of materials simultaneously) no gas, hazardous or benign, is emitted.  He’s thinking of fluorescent lamps and the small amount of mercury they contain.  Even then, a broken fluorescent lamp doesn’t turn the area into a” hazardous waste site.” Here are the EPA’s instructions for cleaning up a broken fluorescent lamp.

White House to Relax Energy Efficiency Rules for Light Bulbs – The New York Times

In 2007 Congress passed the Energy Independence and Security Act (EISA) with the goal of increasing energy efficiency across the economy.  Part of EISA has affected the lighting industry in the form of mandated efficacy of light sources.  The initial efficacy rules targeted A-Lamps (standard household light bulbs) and set the efficacy level above that of incandescent but below that of halogen lamps.  The result was a slow shift to the more energy efficient technology.  Over the years the energy efficiency requirements have been expanded to more lamp shapes, always in keeping with technological ability so that we never faced a lamp shortage or loss of a lamp shape.  Today, more than 50% of lamps sold are LED that exceed even the most stringent requirements.

On September 4th the administration announced that it was going to cancel a new set of requirements that would have taken effect in January 2020 that would have applied to products such as decorative medium base lamps and MR type lamps.  In my opinion, this is another example of the administration cutting off its nose to spite its face.  As with the threat to “investigate” automakers who agree with the State of California’s proposed energy efficiency requirements, this effort to undo energy efficiency despite the monumental consensus that we need to reign in our energy consumption isn’t going to go have any effect.  No lamp manufacturer is going to reopen or build new factories to make incandescent lamps when it’s obvious that A) the next administration is going to reinstate the efficacy requirements B) the public has embraced the energy savings of LED lamps, and C) the companies know that it would be bad for their image to turn their backs on mitigating climate change.

Source: White House to Relax Energy Efficiency Rules for Light Bulbs – The New York Times


Samsung Introduces Chip-on-Board LED Packages Optimized for Commercial Lighting – Samsung Global Newsroom

Source: Samsung Introduces Chip-on-Board LED Packages Optimized for Commercial Lighting – Samsung Global Newsroom

An interesting bit of news from Samsung this week.  They’ve developed an LED package especially designed to achieve an Rg value over 110, “a level that ensures lighting with outstanding color and whiteness.”

It’s important to note that increased saturation means decreased fidelity to the reference light source.  This is a lighting solution that will be desirable in some applications, such as retail,and undesirable in others, such as medical facilities.


IES Disagrees With AMA on Night Time Outdoor Lighting

Last year the AMA issued Policy H-135.927 Human and Environmental Effects of Light Emitting Diode (LED) Community Lighting, which recommended, among other things, that LED outdoor lighting should have a CCT of 3000 K or below.  The AMA made this recommendation thinking that lower correlated color temperatures contain less blue light, which can disrupt circadian rhythms.

Today the IES issued a Position Statement disputing that recommendation, noting that CCT

is inadequate for the purpose of evaluating possible health outcomes; and that the recommendations target only one component of light exposure (spectral composition) of what are well known and established multi-variable inputs to light dosing that affect sleep disruption, including the quantity of light at the retina of the eye and the duration of exposure to that light. A more widely accepted input to the circadian system associated with higher risk for sleep disruption and associated health concerns is increased melanopic content, which is significantly different than CCT. LED light sources can vary widely in their melanopic content for any given CCT; 3000 K LED light sources could have higher relative melanopic content than 2800 K incandescent lighting or 4000 K LED light sources, for example.

Follow the link to read the entire Position Statement.  Blue light hazard, light’s impact on circadian rhythms and overall health, and related topics are a hot area of research.  We’re learning more all the time, but we don’t yet know enough to apply circadian lighting to every situation.  Outdoor and street lighting are among the areas where research is not yet conclusive.


A New Report on LED Color Shift

Like other lighting technologies, the color or chromaticity of light emitted by an LED can shift over time.  To address the challenge of developing accurate lifetime claims, DOE, together with the Next Generation Lighting Industry Alliance, formed an industry working group, the LED Systems Reliability Consortium (LSRC).  A new LSRC report, LED Luminaire Reliability: Impact of Color Shift, focuses on chromaticity. The purpose of the new report is not to define limits for specific applications, but rather to enable a better understanding of how and why color shifts, and how that impacts reliability.  Download it and take a look.


LRC Responds to AMA on LEDs

You may remember that in June of last year the American Medical Association (AMA) released a report called “Human and Environmental Effects of Light Emitting Diode (LED) Community Lighting.” The report made some noise in the general press because it supported the idea that blue light from blue-pump white LEDs contribute to disability glare and retinal damage.

In the lighting community there was a considerable amount of frustration and anger over the report for several reasons. First, there were quite a few references cited that were either hearsay, such as a New York Times article about Brooklyn residents who didn’t like their new LED street lights, or were irrelevant, such as several articles about the effect of skyglow on nesting turtles. The other reason was that there was not a single lighting designer or researcher on the panel. Overall, it was a poorly researched paper that didn’t deserve the attention it received.

Shortly after it was issued, the Lighting Research Center at RPI issued a response paper. On March 15 the authors of that paper held a webinar to further address the AMA report. A video of that webinar is now available. If you’ve got an hour, take a look.

The key takeaways regarding the hazard of blue light from LEDs and the report are:

  1. The criteria of blue light hazard for retinal damage is much more than just color temperature, and includes the source size, intensity per unit area on the retina, and SPD of the light source.
  2. Disability glare is not a function of light source SPD, as the AMA paper suggests, although discomfort glare is. Short wavelengths increase discomfort glare.
  3. Color temperature is the wrong measurement to determine whether or not a light source will affect the circadian system and melatonin production because color temperature does not provide complete SPD information.       For example, some 3,000 K LEDs can have a greater impact than 4,000 K LEDs.
  4. The criteria of blue light hazard for circadian disruption from a light source include – the intensity, duration of exposure, timing of exposure, and SPD.


Street Lighting and Blue Light Information from the Department of Energy

News stories generated by the American Medical Association’s (AMA) community guidance on street lighting has elevated the topic of LED street lighting and its potential effects on health and the environment in the public’s mind. Discussions of these issues have many misperceptions and mischaracterizations of the technical information, and the difference between what has and hasn’t been scientifically established is often blurred.

DOE has assembled a variety of resources on the topic, to provide accurate, in-depth information that clarifies the current state of scientific understanding.

Source: Street Lighting and Blue Light | Department of Energy


Lighting For Plant Health

I have a current project with a green wall, aka living wall, and other greenery in the space. I’ve been given conflicting information about the lighting requirements I need to meet are and how to measure them, so I did some research. This isn’t definitive, but here’s what I’ve found.

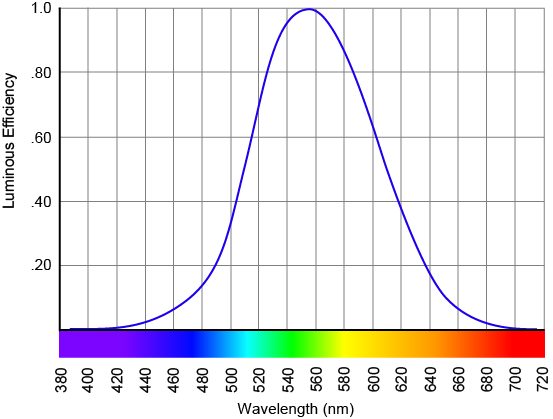
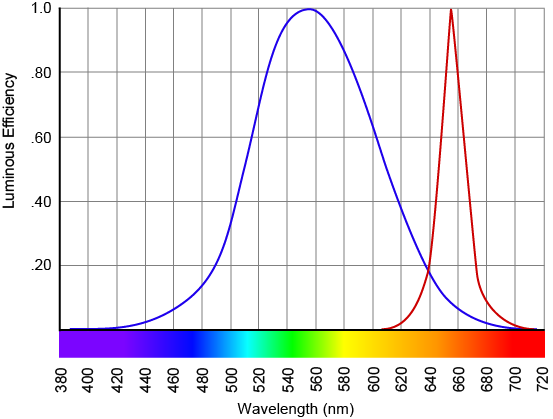
First of all, the measurement units that we’re all familiar with don’t apply to horticulture because the average plant’s response to light is very different from that of the human visual system. We know that the human eye response curve is V(λ) (pronounced vee lambda) which is shown in Figure 1. Our response to electromagnetic energy falls between 380 and 770 nm, with a peak response at 555 nm. In order to measure light the way the human visual system perceived it, V(λ) is folded into the definition of the lumen, the footcandle, etc.
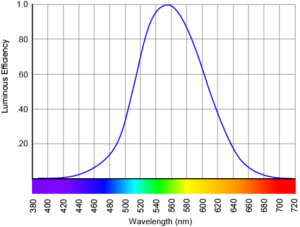
Figure 1 V(λ)

Plants, however, have a response curve called the photosynthesis action spectrum, shown in Figure 2. The wavelengths of light that are absorbed and used by plants are below 520 nm and above 610 nm [i], which roughly equates to the blue and red range of the visible spectrum. Plants need a great deal of red light, a far amount of blue light, and little or no green light.

photosynthetically active spectrum

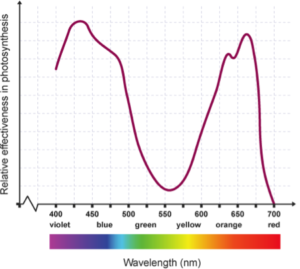
Figure 2 Average photosynthesis action spectrum of chlorophyll [ii]

So, we can’t talk about the amount of light delivered to plants in a useful way if we’re using lumens and footcandles. The measurement of light for plant health is Photosynthetically Active Radiation (PAR) [iii]. There are PAR calibrated light meters, and digital tools to convert lux/footcandle readings to PAR. Other common measurements are also not relevant to horticulture.

  • Color temperature is a numerical indication of the warmth or coolness of white light, but warmth or coolness are aesthetic criteria and are not relevant in light for plant health.
  • CRI is an indicator of how well a light source allows us to see colors when compared to a reference light source. The response of the human visual system to light is built-in to the CRI calculation. Again, for plant health we are not concerned with seeing the colors of the plants so this metric is not relevant.


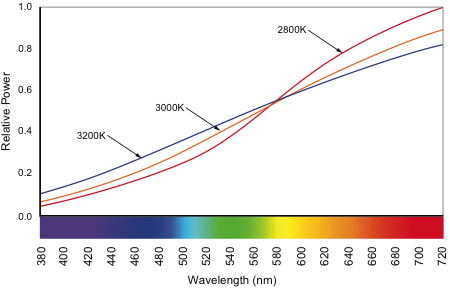
What kind of light should we provide? Incandescent light has an appropriate balance of red and blue light for plant health, as shown in Figure 3. The power consumption will be high. Fortunately, power consumed by the lighting for plant health is exempt from the energy conservation codes. However, with their short life and high power consumption incandescents are, overall, a poor choice.

Incandescent SPD

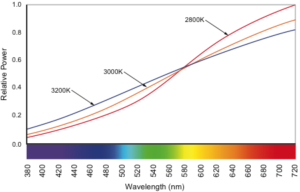
Figure 3 SPD for incandescent light of 2800 K, 3000 K, and 3200 K [iv]

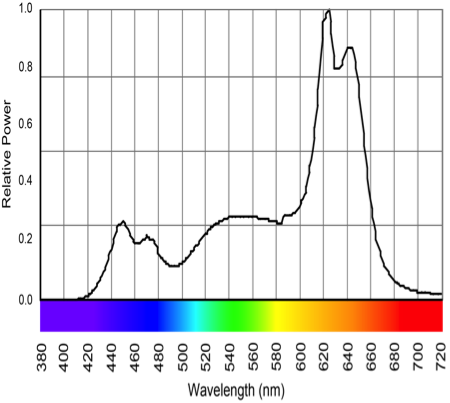
High color temperature metal halide lamps have been the horticulture light source of choice for a long time because their SPD provides an appropriate balance of red and blue light (Figure 4). While metal halide lamps are being replaced by LEDs in many applications, I expect they will be available for at least the next decade. For my project, these fixtures would only to be used during the green wall’s growth period in the morning before the space opens to the public. A second set of fixtures with warmer light will be used when the space is open so that I could light the wall in a way that is in balance with the rest of the space during operating hours.

Metal Halide SPD

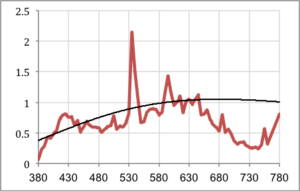
Figure 4 SPD for a 4200 K metal halide [v]

One of the exciting features of LEDs is that they permit fine-tuning of the emitted spectrum. With LEDs it is possible to create a light source that closely follows the photosynthesis action spectra. This has been shown to “improve factors such as yield, flavor, color, plant growth, and flowering as well as pest and pathogen management and control.”[[vi] The impact has been studied, and results so far have been positive, for leaf lettuce [vii], cucumbers [viii], and tomatoes [ix], among others. At least one study has noted, however, has “concluded that the response of plants to the applied light is individual and depends on the species,” [x]

Therefore, an alternative to metal halide fixtures is multi-colored LED fixtures. Since multi-colored LED fixtures allow users to control the brightness of each color individually one could opt for a fixture with a Red, Blue, White (RBW), a Red, Red, Blue, White (RRBW), or a Red, Blue, Blue, White (RBBW) set of LEDs. This would permit one fixture to provide light for health and accent light. One possible result of a RBW fixture is shown in Figure 5. This is a much better match to the photosynthesis action spectra than incandescent, metal halide, or white LEDs.

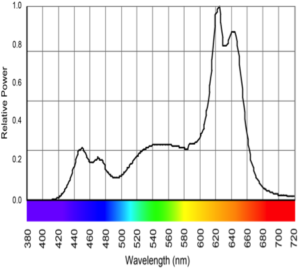
Figure 5 Possible RBW LED produced SPD

For the time being, the people responsible for the greenery have asked me to stay with the tried and true metal halide lamps.  In the near future, as metal halide lamps become rarer, and as LEDs become more common in horticulture, I expect we’ll be changing over to LEDs.


References

[i] Yingchao Xu, Yongxiao Chang, Guanyu Chen, Hongyi Lin, The Research On LED Supplementary Lighting System For Plants, Optik – International Journal for Light and Electron Optics, Volume 127, Issue 18, September 2016, Pages 7193-7201, ISSN 0030-4026, http://dx.doi.org/10.1016/j.ijleo.2016.05.056.

[ii] The Science of Food Production, http://www.bbc.co.uk/education/guides/z23ggk7/revision/2.

[iii] Torres, Ariana P., Lopez, Roberto G., Measuring Daily Light Integral in a Greenhouse, Department of Horticulture and Landscape Architecture, Purdue University, https://www.extension.purdue.edu/extmedia/ho/ho-238-w.pdf

[iv] Livingston, Jason, Designing Light: The Art, Science, and Practice of Architectural Lighting, Hoboken: John Wiley and Sons, 2014.

[v] TM-30-15 Advanced Calculator, Illuminating Engineering Society, New York: Illuminating Engineering Society, 2015.

[vi] Davis, Philip A. and Burns, Claire, Photobiology In Protected Horticulture, Food and Energy Security 2016: 5(4): 223-238. http://onlinelibrary.wiley.com/doi/10.1002/fes3.97/full

[vii] Filippos Bantis, Theoharis Ouzounis, Kalliopi Radoglou, Artificial LED Lighting Enhances Growth Characteristics And Total Phenolic Content Of Ocimum Basilicum, But Variably Affects Transplant success, Scientia Horticulturae, Volume 198, 26 January 2016, Pages 277-283, ISSN 0304-4238, http://dx.doi.org/10.1016/j.scienta.2015.11.014.

[viii] Brazaityte, A., et.al.,  The Effect Of Light-Emitting Diodes Lighting On Cucumber Transplants And After-Effect On Yield, Zemdirbyste, Volume 96, Issue 3, 2009, Pages 102-118. https://www.scopus.com/record/display.uri?eid=2-s2.0-73949144018&origin=inward&txGid=7294EF1D0E6304BAA77C73981961A69E.wsnAw8kcdt7IPYLO0V48gA%3a2 (Login Required)

[ix] Brazaityte, A., et. al., The Effect Of Light-Emitting Diodes Lighting On The Growth Of Tomato Transplants, Zemdirbyste, Volume 97, Issue 2, 2010, Pages 89-98, https://www.scopus.com/record/display.uri?eid=2-s2.0-78249276864&origin=inward&txGid=7294EF1D0E6304BAA77C73981961A69E.wsnAw8kcdt7IPYLO0V48gA%3a7 (Login Required)

[x] Fra̧szczak, B., et. al., Growth Rate Of Sweet Basil And Lemon Balm Plants Grown Under Fluorescent Lamps And Led Modules, Acta Scientiarum Polonorum, Hortorum Cultus, Volume 13, Issue 2, 2014, Pages 3-13, https://www.scopus.com/record/display.uri?eid=2-s2.0-84898647440&origin=inward&txGid=7294EF1D0E6304BAA77C73981961A69E.wsnAw8kcdt7IPYLO0V48gA%3a12 (Login Required)


How Bright Are Colored LEDs?

Measuring and describing the brightness of colored LEDs is an increasingly important part of a lighting designer’s practice. They are used more often, and in more types of projects, than ever before. Yet, we don’t have an accurate method for understanding exactly how much light is being produced and how bright it will appear. It’s a problem that the lighting industry needs to solve, and soon.

The human eye does not respond to all wavelengths of light equally. We have the greatest response to the yellow-green light of 555 nm. Our response falls off considerably in both directions.  That is, wavelengths of light do not contribute equally to our perception of brightness. The sensitivity curve of the human eye is called V(λ) (pronounced vee lambda) and is shown below.

The definition of a lumen, the measurement of brightness of a light source, is weighted using V(λ) and essentially assumes that the light source emits light across the visible spectrum – in other words, it produces a version of white light.

Light meters are calibrated to measure white light using V(λ) so that their measurement of brightness corresponds with our perception. Individual colored LEDs emit only a fraction of the visible spectrum, as shown below in the graph of V(λ) and the SPD of a red LED, and that’s the problem.

V(λ) and the SPD of a red LED.

Light meters measure the light that the colored LEDs provide, of course, and this information is included on an LED fixture manufacturer’s cut sheets, but it often makes no sense. For example, an RGBW fixture I’ve arbitrarily selected reports the following output in lumens: Red 388, Green 1,039, Blue 85, White 1,498. Since brightness is additive, the output when all LEDs are at full should be 3,010 lumens. However the Full RGBW output is given as 2,805 lumens! That’s 7% lower than what we expect.

The essential problem is that the colored LEDs give the light meter only a fraction of the spectrum it’s designed to measure. The meter provides a result based on its programming and calibration, but the results are often nonsensical or at odds with our perception. This problem doesn’t affect only architectural lighting designers. Film and TV directors of photography and lighting directors also rely on a light meter’s accurate measurement of brightness in their work, and when using colored LED fixtures the light meter is likely to be wrong. In fact, even white light LEDs can be difficult to measure accurately because of the blue spike in their SPD.

For now, the only way to accurately assess the brightness of colored LEDs is to see them in use. Lighting professionals need to let manufacturers and others know that the current situation is not acceptable, and that an accurate method of measuring and reporting the brightness of colored LEDs is a high priority. Talk to fixture and lamp sales reps, fixture and lamp manufacturers, and decision makers at IES, CIE, NIST and other research and standards setting organizations. There’s a solution out there. We need to urge those with the skills and resources to find it to get going!