A very interesting article in today’s New York Times. Sustainability Advocates Ask: Why Demolish When You Can Deconstruct? – The New York Times
The companion blog to the books Designing With Light and Fundamentals of Energy Efficient Lighting and Controls
A very interesting article in today’s New York Times. Sustainability Advocates Ask: Why Demolish When You Can Deconstruct? – The New York Times
There’s an excellent post on the IES’s FIRES blog. It recounts some of the the history of V(λ) and our pursuit of measurements for brightness. It points out how much we’ve learned since the metrics we use today were developed, and calls for rethinking and development of new, 21st century metrics. Read it!
Source: The Test of Time – Illuminating Engineering Society
My colleague Tony Esposito and I will be giving a new TM-30 seminar and demonstration at ArchLIGHT Summit 2021 in Dallas on September 21st and 22nd. We’re working on a new, and we hope more attendee friendly, presentation and an all new set of demonstrations to explain TM-30s Annex E specifications. The demo will include, for the first time, live models of different ethnicities so attendees can evaluate the impact of of the specifications on skin tone. I hope to see you there!
Many of us on the IES Color Committee, myself included, have written and spoken about TM-30 and how to use it. I’ve written posts on this blog (click on the color rendering tag to see them all), authored articles, spoken at IES Annual Conferences, given webinars to architects and lighting designers, and assisted manufacturers in adding TM-30 data to their cut sheets. Despite our efforts, and those of others, TM-30 is still not as well understood and broadly implemented as it could be.
A recent issue of Leukos featured an excellent tutorial by Michael Royer of Pacific Northwest National Laboratory. In it, he describes the development of TM-30, color rendering fundamentals, the workings of the TM-30 calculation framework, TM-30 measures and their meaning, and more. That article is now available on the US Department of Energy’s website here. Anyone who’s unsure about TM-30 will find it immensely useful.
On a related note, many members of the IES Color Committee, myself included, can make themselves available to answer questions or present webinars to architects, interior designers, lighting designers, electrical engineers, sales reps, and manufacturers. If you’re interested, use the Contact Jason Livingston link above to send me a message. If I’m not available or the right person for your organization I’ll find someone who is.
You may recall that in 2019 the Trump administration blocked a rule intended to phase out incandescent lamps and encourage a conversation to more energy efficient models, namely LEDs. If you don’t remember the New York Times and NPR both had articles, among many others.
Last week, the Consumer Federation of America and the National Consumer Law Center, along with 24 other groups across the country, urged the U.S. Department of Energy (DOE) Secretary Granholm to implement the efficiency standard for household lighting products mandated by Congress as soon as is practicable. They claim that “Each month of delay costs American consumers nearly $300 million in lost utility savings and results in another 800,000 tons of climate changing CO2 emissions over the lifetimes of the incandescent bulbs sold in that month.”
You can read the entire press release at Consumerfed.org
Last week I was in Boston and wanted to visit the USS Constitution. The ship was closed but the visitors center was open. When I went inside and tried to read the exhibit signage, here’s what I saw:
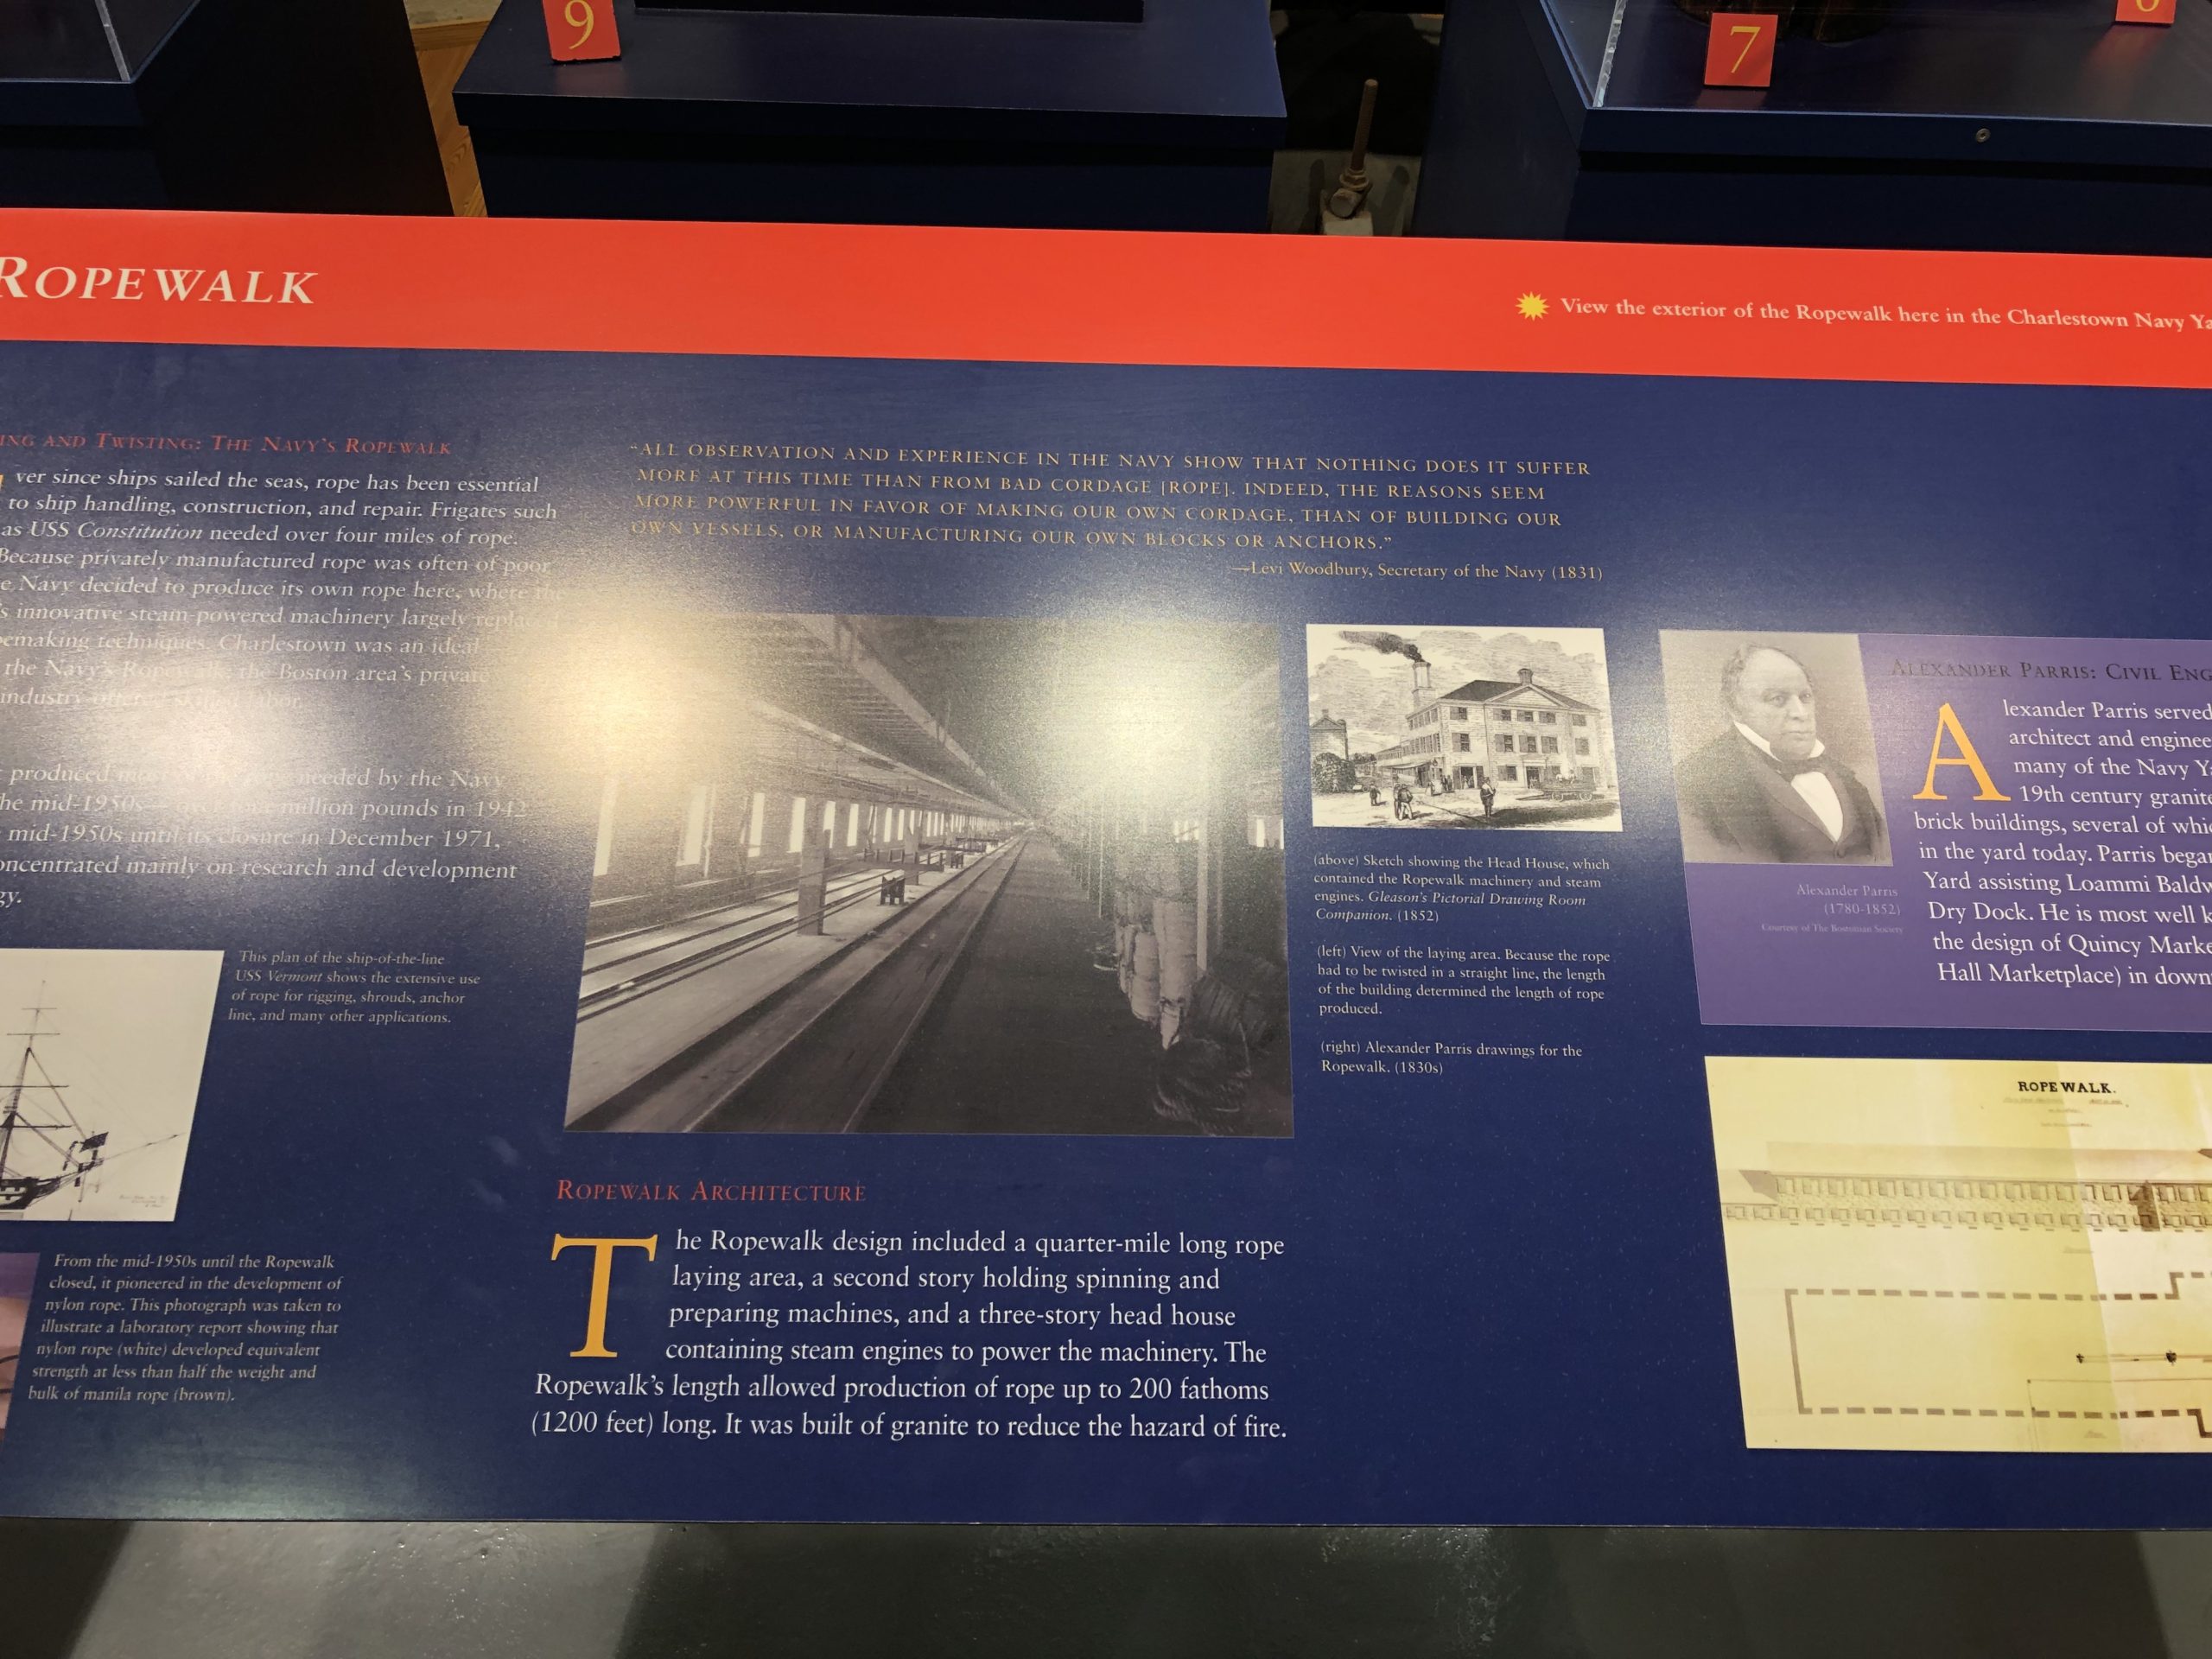
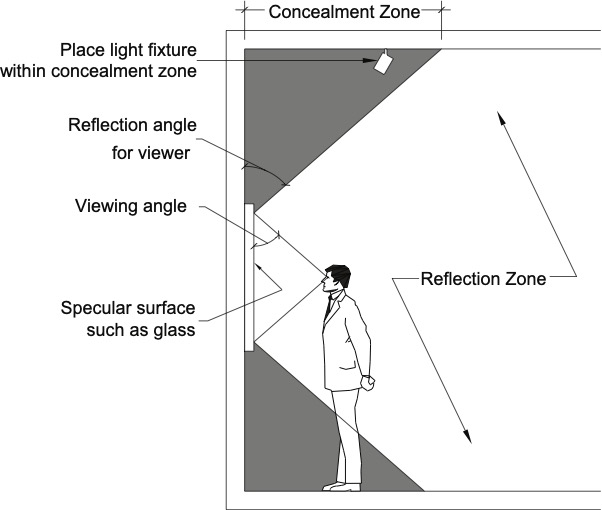
Track lights were positioned right over the semi-gloss signs, creating terrible reflected glare. The thing is, this is so easy to avoid. In fact, someone almost has to try to create lighting this bad. Here’s how to avoid it.
Nearly all lamps found in residential and commercial spaces are included in the ban, which goes into effect in September. It seems that stage and studio lamps are exempt for now.
Source: Halogen lightbulb sales to be banned in UK under climate change plans – BBC News
Over the past few months I’ve had a manufacturer, a sales rep, and a lighting designer all tell me they think CRI compares a light source to daylight. When I tried to correct one of them the reply was an acknowledgment that an incandescent source is normally used, but daylight can be used, too. Given that the lighting industry has been using CRI since 1965, all three should have known better. On the assumption that they’re not alone in their misunderstanding, let’s talk about reference light sources.
The International Commission on Illumination (CIE for Commission Internationale de l’Eclairage) and the Illuminating Engineering Society (IES) both define color rendering as, “The effect of an illuminant on the color appearance of objects by conscious or subconscious comparison with their color appearance under a reference illuminant.” In other words, we evaluate the color rendering of a given light source by comparing it to another light source. The other light source is called the reference illuminant.
In 1965 the CIE published CIE 13 Method of Measuring and Specifying Colour Rendering Properties of Light Sources. The current version is CIE 13.3-1995. Its General Color Rendering Index, Ra, is usually referred to as CRI. CIE 13.3 says, “the reference illuminant for light sources with correlated colour temperatures below 5000 K shall be a Planckian radiator, and from 5000 K one of a series of spectral power distributions of phases of daylight.”
So, the reference illuminant must have the same color temperature or correlated color temperature (CCT) as the light source being tested. For all light sources with a CCT below 5000 K we use the spectrum of a Plankian, or blackbody, radiator. For all light sources with a CCT of 5000 K or above we use a CIE model of daylight, again at the same CCT as the light source we’re testing.
Regular readers of this blog know that I’m not a fan of CRI, greatly preferring the increased accuracy and depth of information provided by ANSI/IES TM-30 IES Method for Evaluating Light Source Color Rendition. What about TM-30’s reference light source? It’s nearly the same. For CCTs of 4000 K and below it’s a Plankian radiator. For CCTs of 5000 K and above, it’s the CIE model of daylight. TM-30 avoids CRI’s sudden jump between reference illuminants by using a graduated blend of Plankian radiator and daylight over the range of 4001 to 4999 K.
CIE 224 Color Fidelity Index for Accurate Scientific Use is identical to TM-30’s Fidelity Index (Rf) and uses the same reference light sources.
On April 21, 2021, DOE issued a preliminary determination that Standard 90.1-2019 will achieve greater energy efficiency in buildings subject to the code. DOE estimates national savings in commercial buildings of approximately:
If the DOE makes a final affirmative determination, and it likely will, states will have two years to certify that they have reviewed the provisions of their commercial building code regarding energy efficiency, and, as necessary, updated their codes to meet or exceed the updated edition of Standard 90.1.
Since 1992, 42 U.S.C. 6833 has required the DOE to evaluate new versions of ASHRAE 90.1 or its successor to determine if adopting the new version as a nationwide minimum standard would improve energy efficiency in commercial buildings. If it does, “each State shall, not later than 2 years after the date of the publication of such determination, certify that it has reviewed and updated the provisions of its commercial building code regarding energy efficiency in accordance with the revised standard for which such determination was made. Such certification shall include a demonstration that the provisions of such State’s commercial building code regarding energy efficiency meet or exceed such revised standard.”
Recently, a well-known lighting designer gave a presentation at a well-known lighting conference. During the Q&A he was asked his opinion of TM-30 and replied that it was too hard so he just specified CRI>90. At the risk of sounding like a jerk I have to say that maybe it was too hard for him, but it’s not too hard for most of us. Here is a brief list of new things lighting designers have had to learn over the years.
There is a ton of TM-30 educational material available, including posts on this blog here, here, here, here, here, and here. There’s this article on the IES’s FIRES Forum, and this page on the Department of Energy web site. Manufacturers are also providing education including DMF Lighting, Soraa, Premier Lighting, Alphabet, and Lighting Services Inc. Then there are the articles in trade magazines and sites such as Lux Review and Architect Magazine, not to mention many articles in Lighting Design and Application and Leukos (no links because they’re behind the IES login). In addition, there have been presentations at other conferences (some given by me) at the IES Annual Conference, LightFair, and LEDucation.
If that’s not enough for you, let me know. I have a presentation approved for one AIA HSW LU, so if you’re architectural firm wants to learn more let’s set up a presentation. Ditto for lighting design firms and teachers of lighting. If I’m not available there are a half dozen others on the IES Color Committee who regularly give TM-30 presentations. You can learn TM-30. I’m here to help.